🌍 Public
Adjacency matrix V1
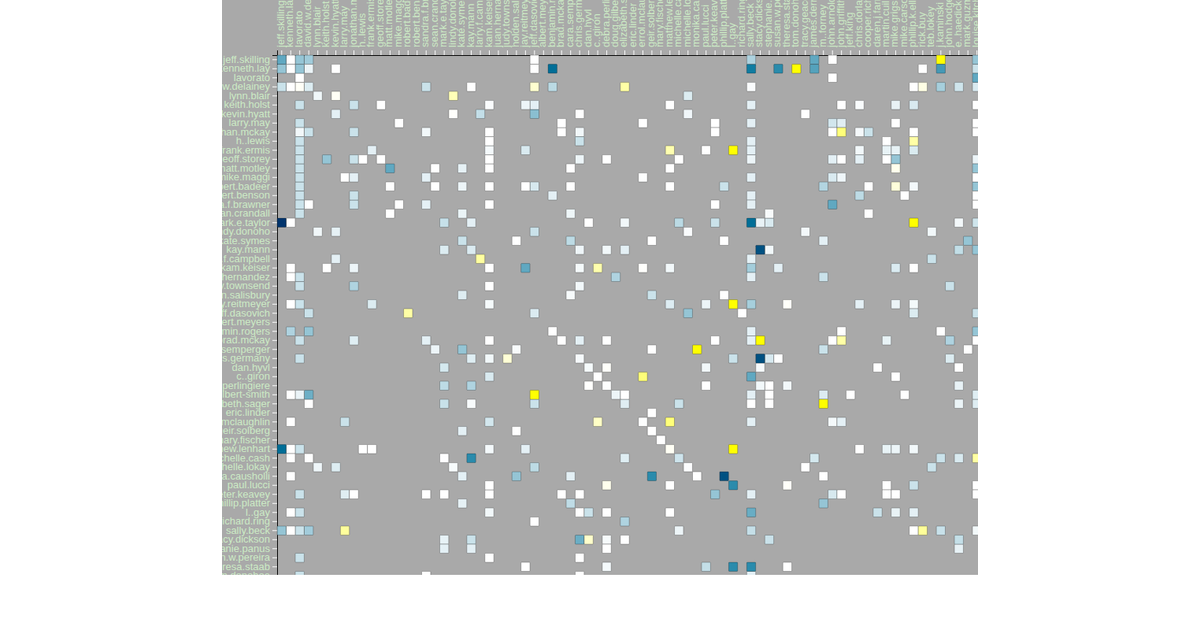
This adjacency matrix visualizes email communication patterns from the Enron corpus, mapping each of the 149 unique sender and recipient IDs along the x- and y-axes. Cell color encodes average sentiment per sender-recipient pair, ranging from blue (negative) through white (neutral) to red (positive). The visualization uses D3 v4’s `scaleBand` for axes, `d3.nest` for hierarchical data aggregation, and `d3.scaleLinear` for the sentiment color scale, rendered as SVG with zoom support via `d3.zoom`.
AI-generated descriptionA bare minimum HTML page demonstrating use of CSS and JavaScript.
See also React Starter.
MIT Licensed


Comments
Sign in to join the discussion.