🌍 Public
Cheap Tricks for Map Interaction II
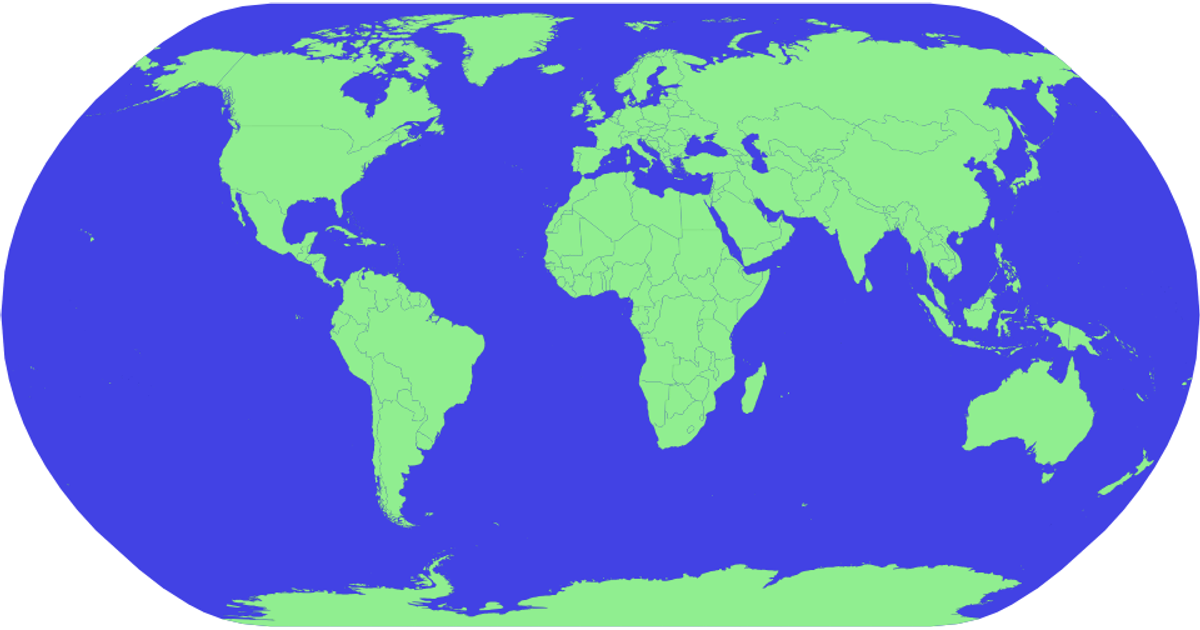
This example shows an interactive world map that changes country colors to red on hover, with a blue sphere background representing the globe. It uses d3.geoPath with a d3.geoNaturalEarth1 projection to render geographic features, while d3.json and d3.tsv load TopoJSON and tabular data from the world-atlas package. The SVG-based visualization applies CSS hover effects to fill countries red, and each country path includes a title element for potential tooltips. The code relies on topojson.feature to convert TopoJSON into GeoJSON for path generation.
AI-generated descriptionMIT Licensed


Comments
Sign in to join the discussion.