🌍 Public
Working with Time Connected dots
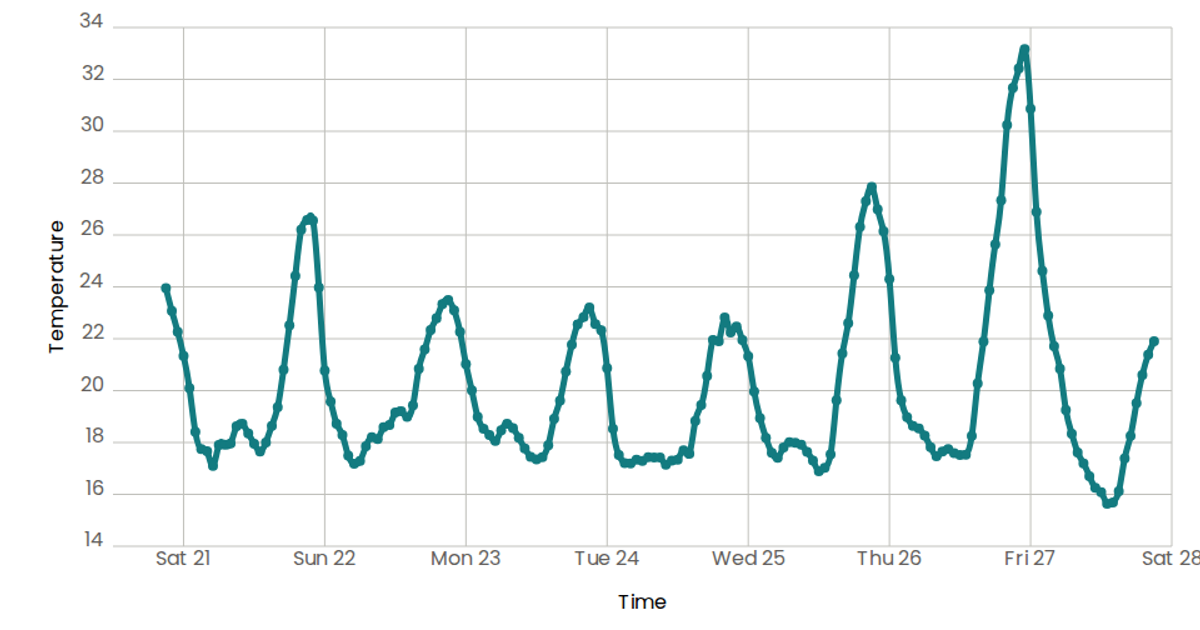
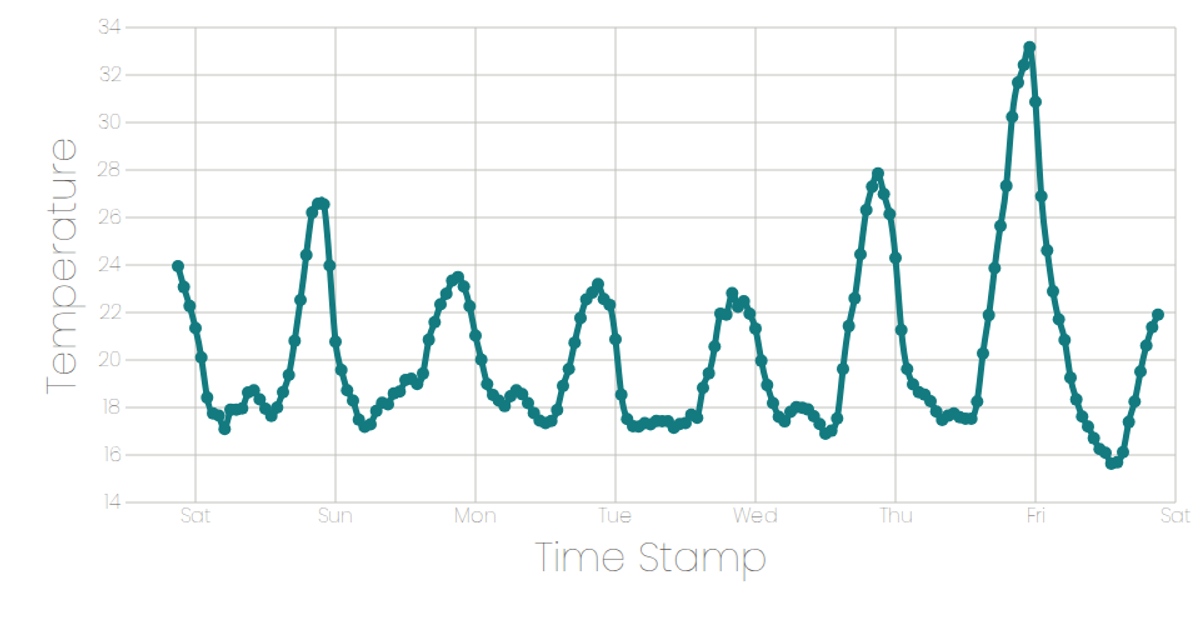
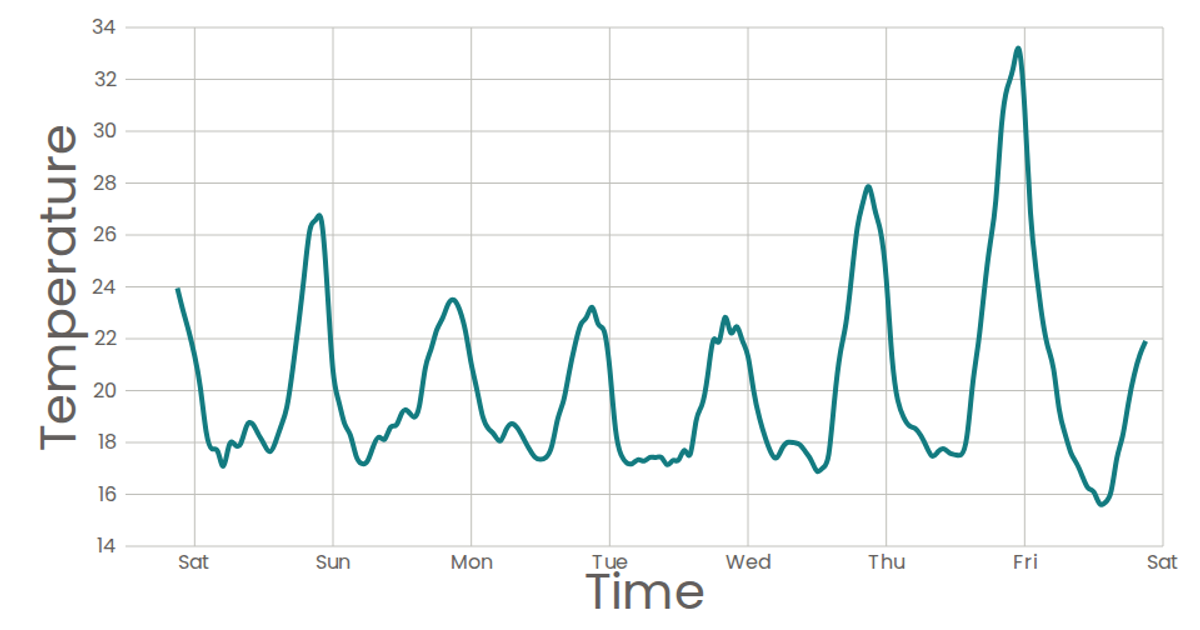
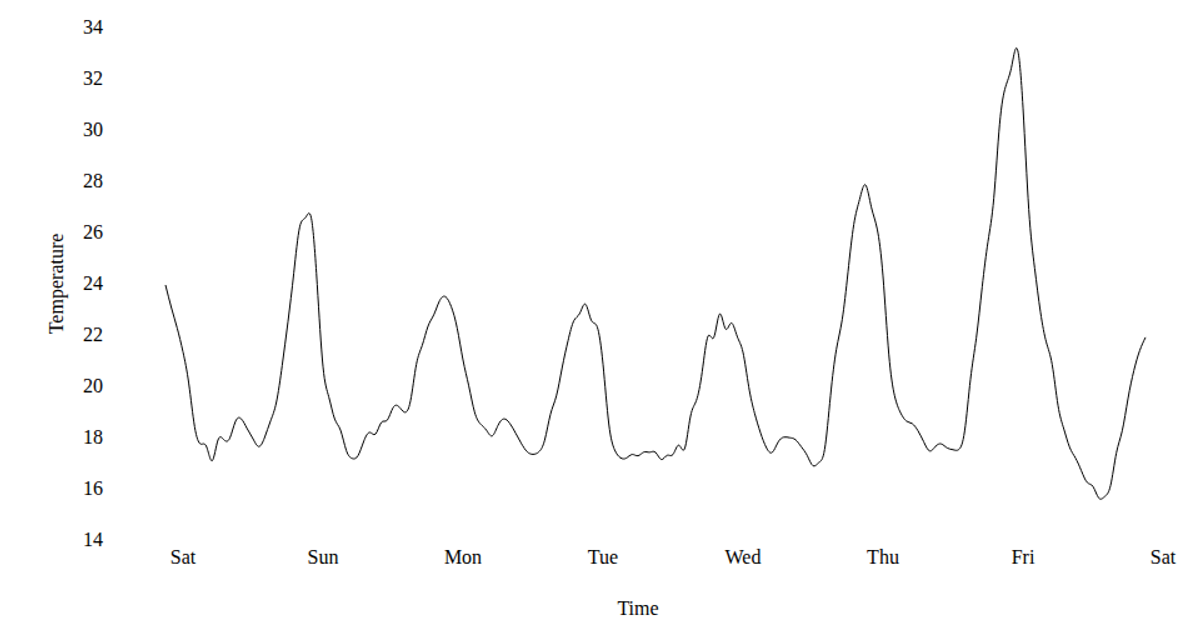
This example visualizes temperature readings over a week in San Francisco, plotting a smooth line through connected time-series data points. The chart uses D3 scales (`scaleTime` and `scaleLinear`) to map timestamps and temperatures, while React components render the SVG axes and marks. The `Marks` component builds a natural curve path using `d3.line` with `curveNatural`, which only draws the line without individual numeric labels for each point. Data is loaded asynchronously from a CSV file using D3’s `csv` parser, and the resulting graphic includes labeled axes, a title, and a clean, minimal styling with a teal stroke.
AI-generated descriptionA program that loads and parses some CSV data: CSS Named Colors.
MIT Licensed




Comments
Sign in to join the discussion.