forcox43

@forcox43
Public vizzes
Starred vizzes

Public vizzes

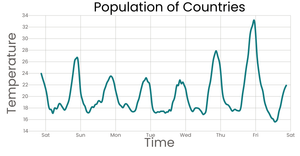
Working with Time Connected dots
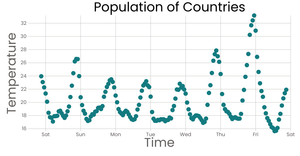
0
Forks
0
Stars
forcox43
forcox43
Sep 21, 2020

Working with Time

1
Fork
0
Stars
forcox43
forcox43
Sep 16, 2020

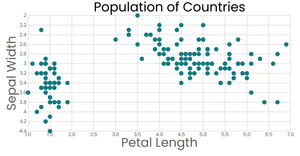
Stylized scatter plot of the Iris Dataset
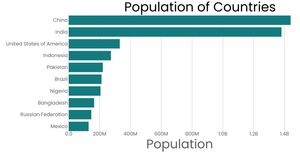
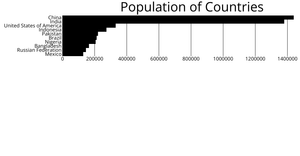
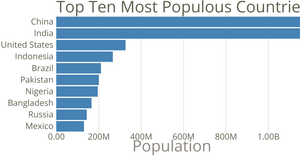
1
Fork
0
Stars
forcox43
forcox43
Sep 16, 2020

Stylized Bar Chart

1
Fork
0
Stars
forcox43
forcox43
Sep 16, 2020

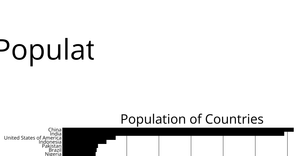
Refactored Bar Chart

1
Fork
0
Stars
forcox43
forcox43
Sep 15, 2020

Axes with React and D3

1
Fork
0
Stars
forcox43
forcox43
Sep 08, 2020

The Margin Convention

1
Fork
0
Stars
forcox43
forcox43
Sep 04, 2020

Rendering Pathetic Bar Chart data with React and D3 number 3

1
Fork
0
Stars
forcox43
forcox43
Sep 04, 2020

Rendering data with React and D3 number 2

1
Fork
0
Stars
forcox43
forcox43
Sep 02, 2020

Rendering data with React and D3

1
Fork
0
Stars
forcox43
forcox43
Sep 02, 2020

Rendering data with React and D3

1
Fork
0
Stars
forcox43
forcox43
Sep 02, 2020

Vega-Lite API Template

0
Forks
0
Stars
forcox43
forcox43
Sep 01, 2020

Loading data with React and D3

1
Fork
0
Stars
forcox43
forcox43
Sep 01, 2020

Loading and Parsing CSV Data

1
Fork
0
Stars
forcox43
forcox43
Sep 01, 2020

Melting Data for Multiple Lines with D3.js!

1
Fork
0
Stars
forcox43
forcox43
Aug 13, 2020

Selecting a Year on a Line Chart with D3.js!

0
Forks
0
Stars
forcox43
forcox43
Jul 22, 2020

Line Chart with Multiple Lines with D3.js!

1
Fork
0
Stars
forcox43
forcox43
Jul 22, 2020

Circles on a Map with D3.js!

0
Forks
0
Stars
forcox43
forcox43
Jul 21, 2020

Cars Scatter Plot with menus with D3.js!

0
Forks
0
Stars
forcox43
forcox43
Jul 21, 2020

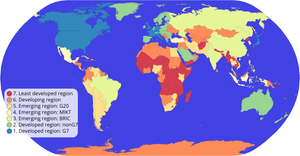
Choropleth map with Interactive Filtering in D3.js!

0
Forks
0
Stars
forcox43
forcox43
Jul 21, 2020

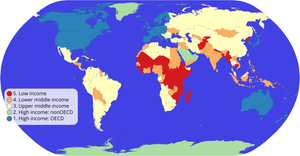
Choropleth map with D3.js!

3
Forks
0
Stars
forcox43
forcox43
Jul 18, 2020

Color and size legends with D3.js!

0
Forks
0
Stars
forcox43
forcox43
Jul 16, 2020

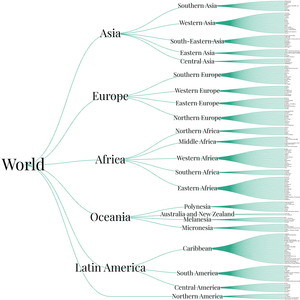
World Countries Tree with D3.js!

0
Forks
0
Stars
forcox43
forcox43
Jul 16, 2020

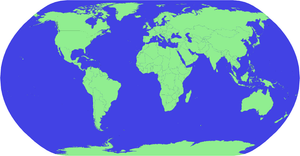
BLANK CANVAS with D3.js!

1
Fork
0
Stars
forcox43
forcox43
Jul 15, 2020

Cheap tricks with interaction with a map with D3.js!

1
Fork
0
Stars
forcox43
forcox43
Jul 15, 2020

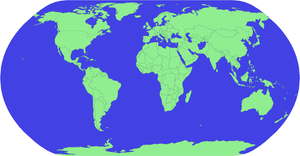
Let's make a map with D3.js!

1
Fork
0
Stars
forcox43
forcox43
Jul 15, 2020

Bowl of Fruit - Hoover to select events with D3.js!

0
Forks
0
Stars
forcox43
forcox43
Jul 15, 2020

Bowl of Fruit - Click events with D3.js!

2
Forks
0
Stars
forcox43
forcox43
Jul 15, 2020

Bowl of Fruit - Click to select! with D3.js!

0
Forks
0
Stars
forcox43
forcox43
Jul 15, 2020

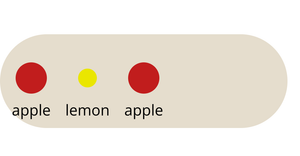
Bowl of Fruit - General Update Pattern with labels! with D3.js!

3
Forks
0
Stars
forcox43
forcox43
Jul 12, 2020

Bowl of Fruit - General Update Pattern with D3.js!

2
Forks
0
Stars
forcox43
forcox43
Jul 12, 2020

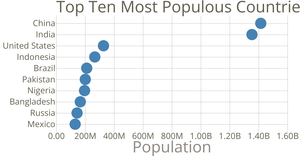
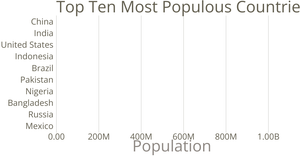
World Population Area Chart with D3.js!

0
Forks
0
Stars
forcox43
forcox43
Jul 12, 2020

Temperature in SF Line Chart with D3.js!

2
Forks
0
Stars
forcox43
forcox43
Jul 12, 2020

Temperature in SF Line Chart with D3.js!

2
Forks
0
Stars
forcox43
forcox43
Jul 12, 2020

Temperature in SF Scatter Plot with D3.js!

1
Fork
0
Stars
forcox43
forcox43
Jul 12, 2020

Cars Scatter Plot with D3.js!

2
Forks
0
Stars
forcox43
forcox43
Jul 12, 2020

Scatter Plot with D3.js!

1
Fork
0
Stars
forcox43
forcox43
Jul 12, 2020

Making a Bar Chart with D3.js!

1
Fork
0
Stars
forcox43
forcox43
Jul 10, 2020

Making a Bar Chart with D3.js!

1
Fork
0
Stars
forcox43
forcox43
Jul 10, 2020

Making a Bar Chart with D3.js!

1
Fork
0
Stars
forcox43
forcox43
Jul 10, 2020

Let's make a face with D3.js!

4
Forks
0
Stars
forcox43
forcox43
Jun 08, 2020