🌍 Public
Reusable scatterplot
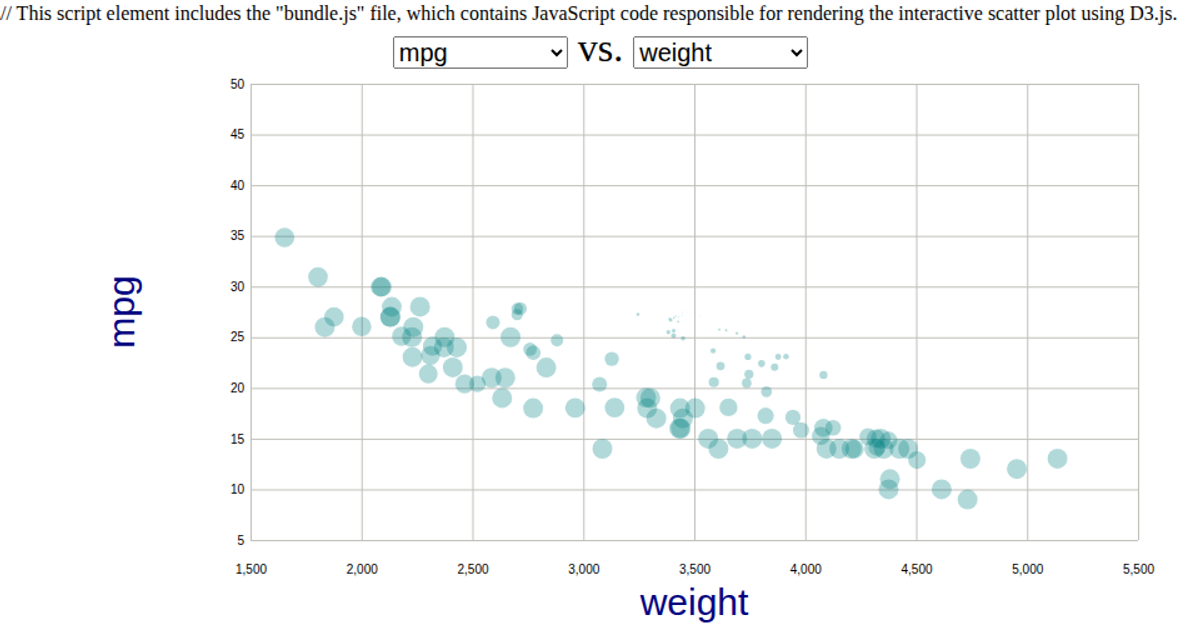
This interactive scatterplot compares pairs of attributes from the UCI Auto MPG dataset, letting users select any two columns from the uploaded CSV to plot against each other via dropdown menus. Built with D3 v5, the visualization uses `scaleLinear` and `extent` for axes, plus `axisLeft` and `axisBottom` for ticks. Points animate into place with staggered transitions, while the reusable `scatterPlot` and `dropdownmenu` modules manage the SVG rendering and menu selection. Data is parsed from a remote CSV file, with numeric columns coerced to numbers.
AI-generated descriptionThis Scatterplot shows data about cars fom UCI Machine Learning Repository: Auto MPG Data Set
MIT Licensed


Comments
Sign in to join the discussion.