🌍 Public
Reuablescatterplot
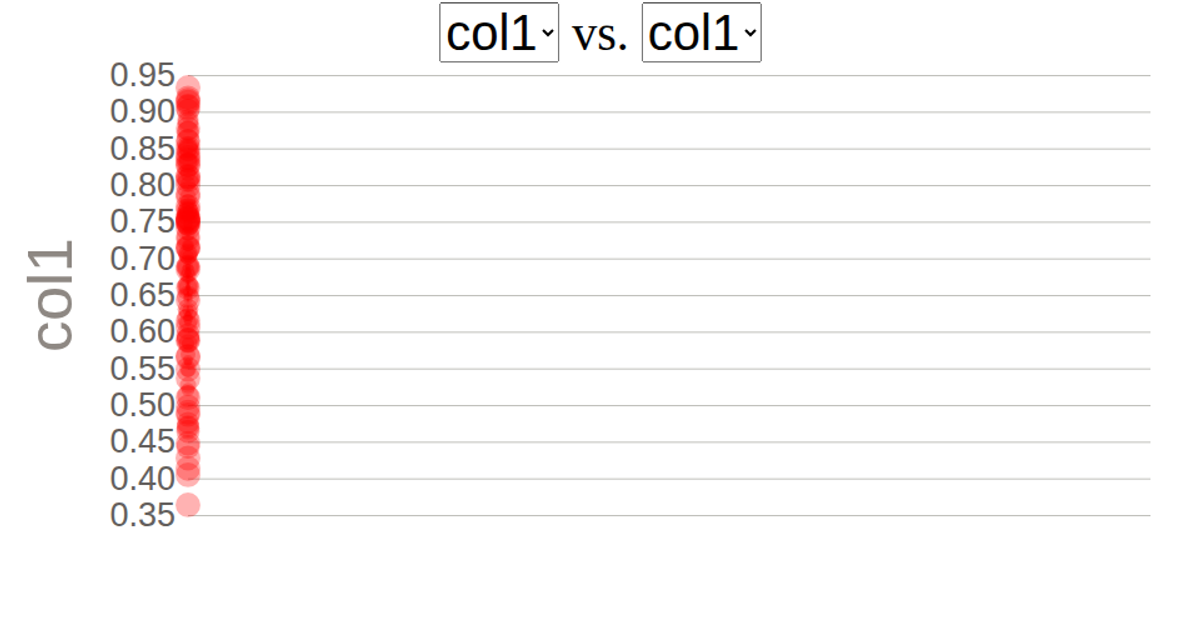
This interactive scatterplot visualizes automobile data from the UCI Machine Learning Repository’s Auto MPG dataset. Users select which numerical attributes to compare via two dropdown menus, which re-render the chart. Built with D3 v5, the visualization uses `scaleLinear`, `axisLeft`, `axisBottom`, and animated circle transitions. SVG rendering displays data points for attributes like horsepower, weight, and acceleration, with labeled axes and gridlines. The code structures reusable dropdown and scatterplot components, enabling dynamic exploration of relationships between any two selected data columns.
AI-generated descriptionThis Scatterplot shows data about cars fom UCI Machine Learning Repository: Auto MPG Data Set
MIT Licensed




Comments
Sign in to join the discussion.