🌍 Public
COVID-19 Country measures
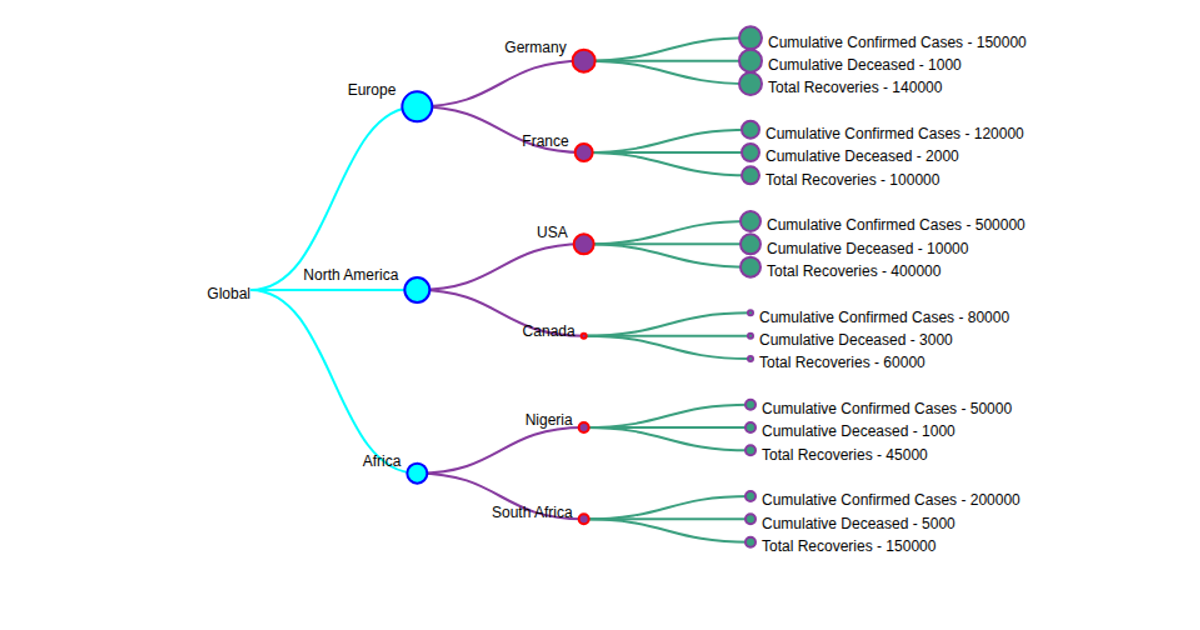
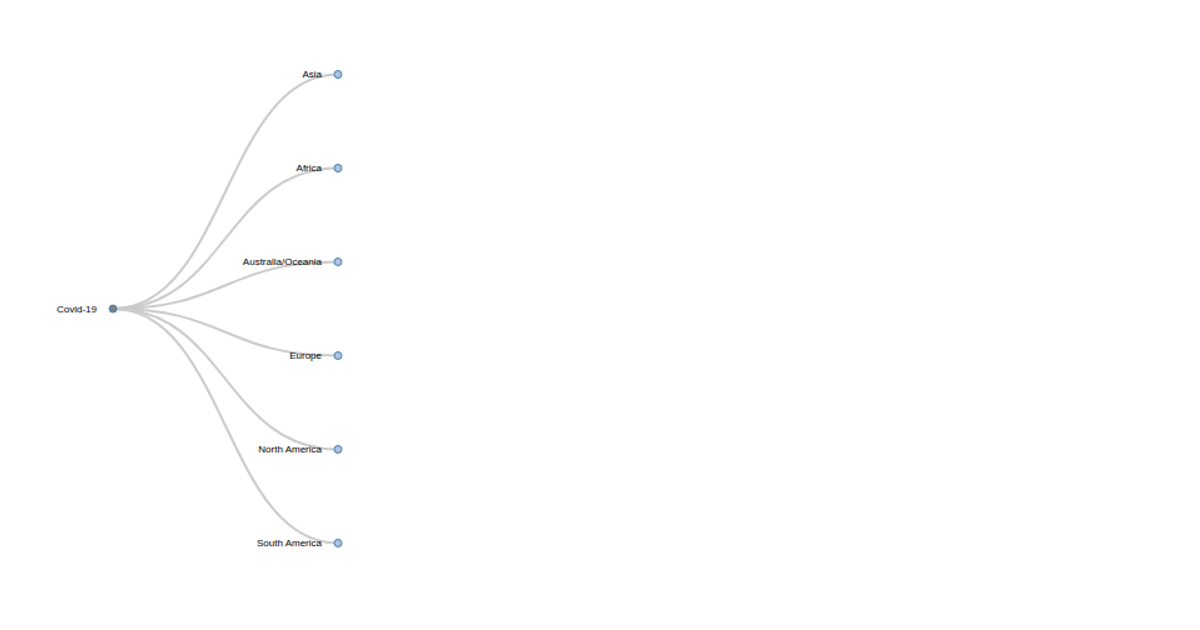
This interactive tree visualization displays hierarchical data on COVID-19 country measures, sourced from a pipe-delimited CSV file. Built with D3 v3 and jQuery, it renders an SVG layout where users can click nodes to expand or collapse branches, pan/zoom via d3.behavior.zoom, and hover to highlight relationships through opacity changes and label formatting. The d3.layout.tree and d3.svg.diagonal APIs structure the hierarchy, while manual box adjustments and centered node transitions enhance navigation.
AI-generated descriptionMIT Licensed




Comments
Sign in to join the discussion.