🌍 Public
COVID-19 Country measures
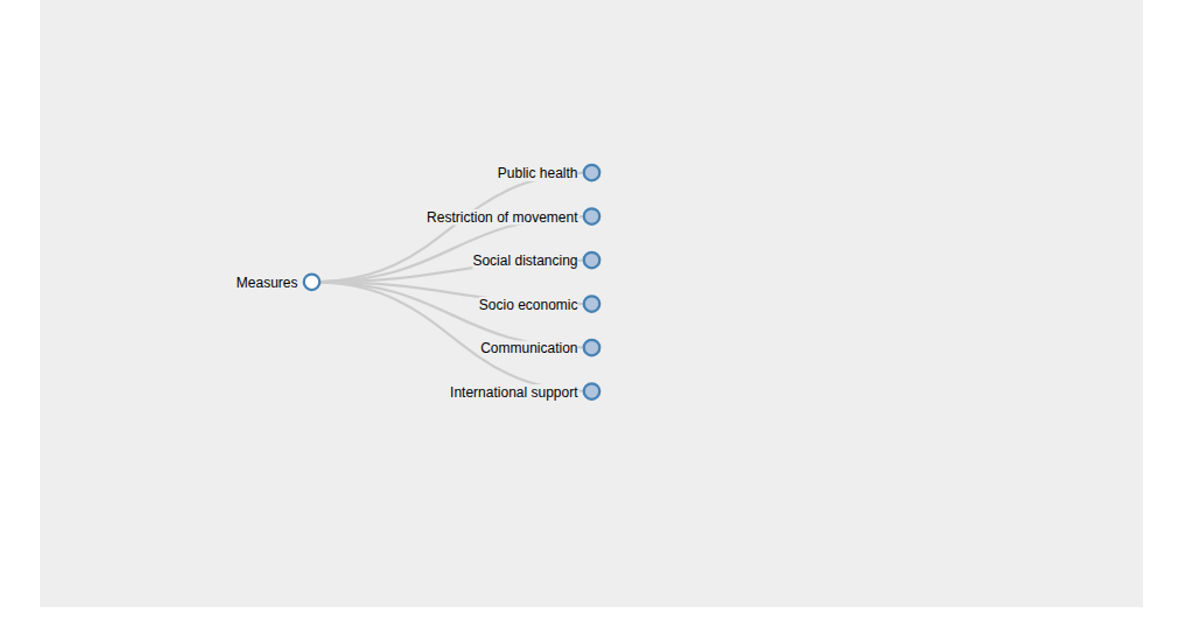
This visualization presents COVID-19 country measures as an interactive, collapsible tree diagram. Users can click nodes to expand or collapse branches, with pan and zoom controls for navigation. The tree layout uses d3.layout.tree and d3.svg.diagonal for links, while d3.behavior.zoom enables scaling. Data is loaded from a CSV file using d3.dsv with pipe delimiters, and node text is displayed via SVG elements that appear on hover.
AI-generated descriptionMIT Licensed



Comments
Sign in to join the discussion.