🌍 Public
Fork of Bar chart
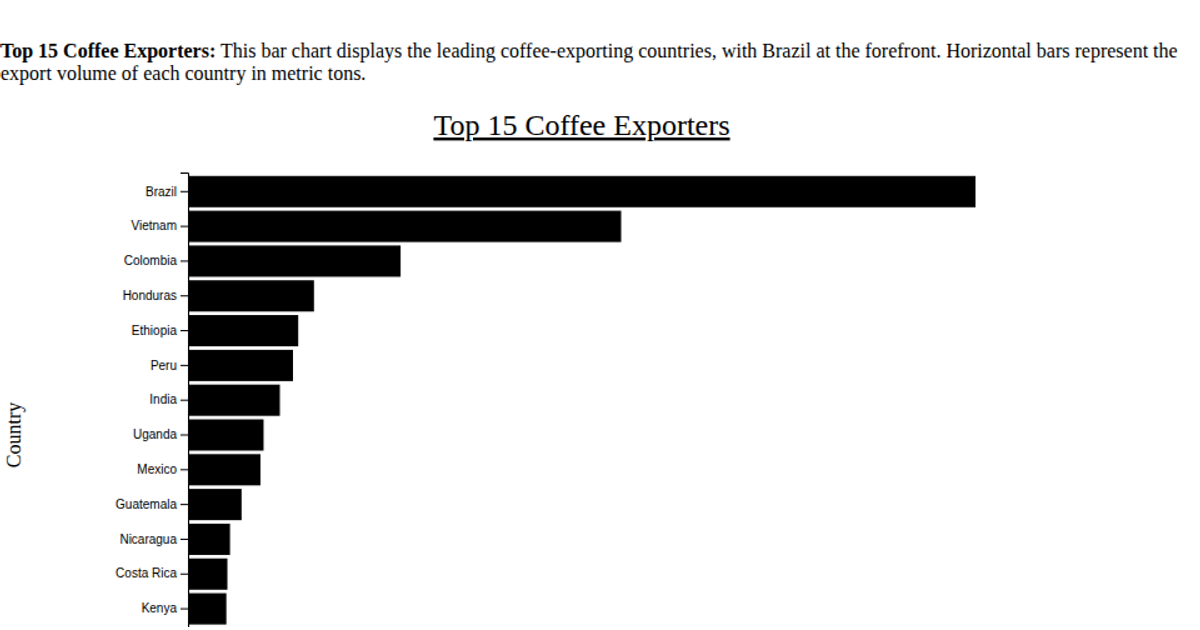
This chart shows the top 15 coffee-exporting countries by metric tons, with Brazil leading the list. The horizontal bar chart uses `d3.scaleBand` for the categorical country axis and `d3.scaleLinear` for the numerical export volume axis. Data loaded from a remote CSV is sorted in descending order and filtered to the top 15 entries. Named `d3.axisBottom` and `d3.axisLeft` add the axes, while SVG rectangles render the bars with the y-axis label rotated for readability.
AI-generated descriptionMIT Licensed




Comments
Sign in to join the discussion.