🌍 Public
Fork of Bar chart
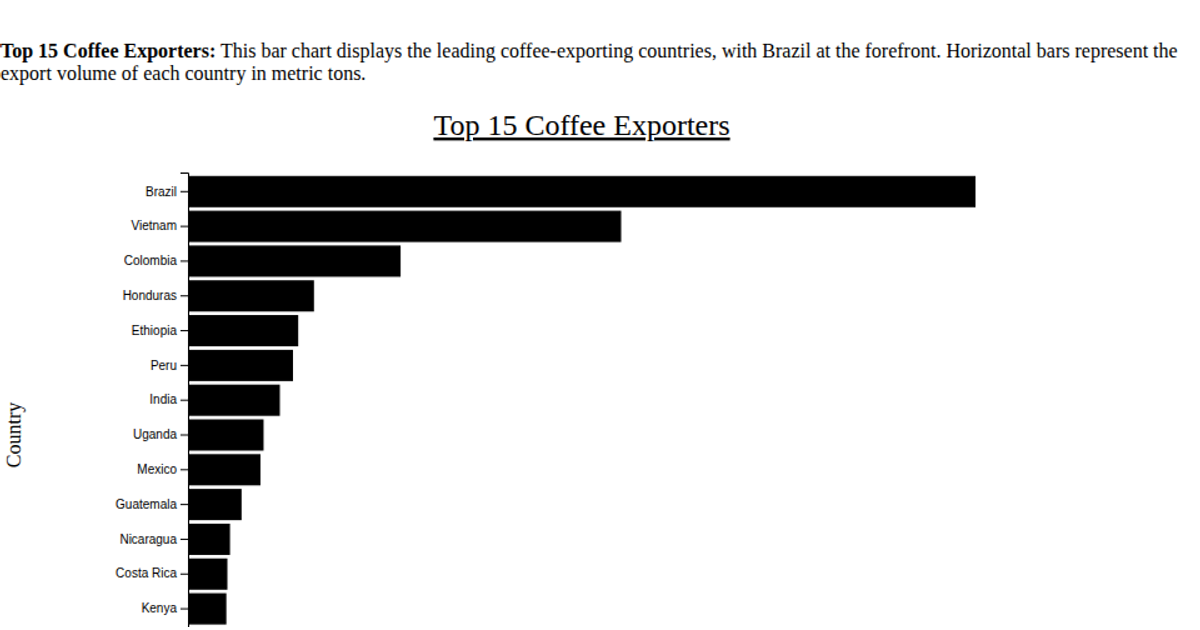
This example visualizes the top 15 coffee-exporting countries using a horizontal bar chart, with Brazil leading in export volume. The data is loaded from a CSV file and sorted in descending order, with each bar’s length proportional to metric tons exported. D3 v7 renders the chart as an SVG, using a linear scale for the x-axis and a band scale for the y-axis, and includes rotated tick labels for readability. The visualization is titled "Top 15 Coffee Exporters" and includes axis labels for clarity.
AI-generated descriptionMIT Licensed



Comments
Sign in to join the discussion.