🌍 Public
Fork of Cheap Tricks for Interaction
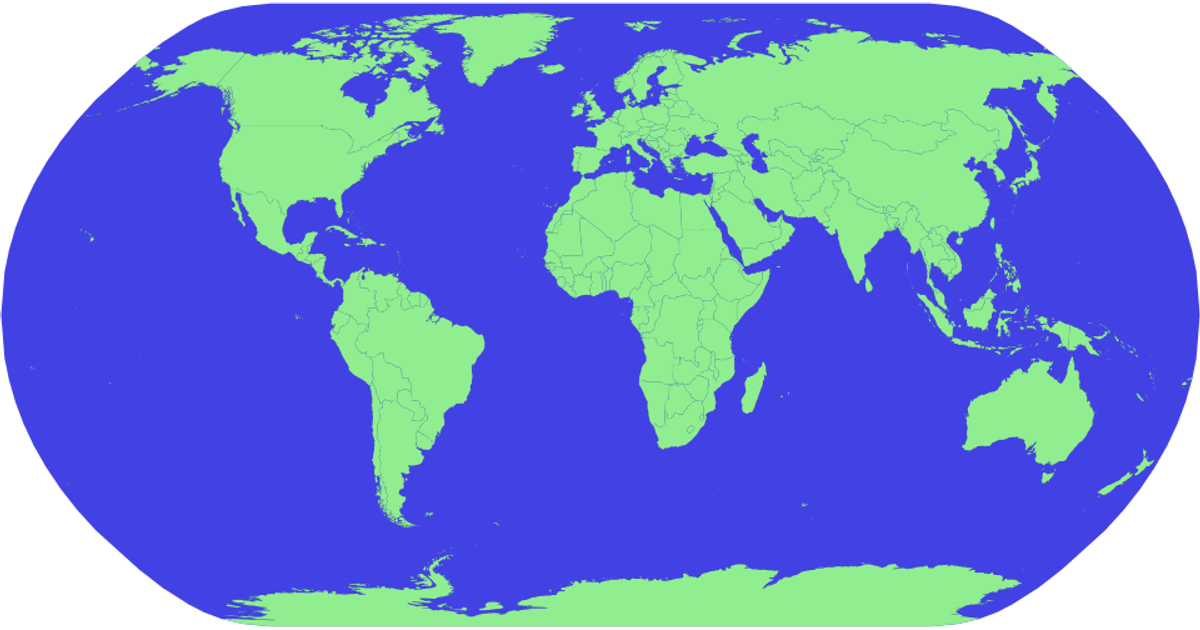
This interactive D3.js map displays world countries, colored light green against a blue sphere, and highlights each country in red on hover with a tooltip showing the country’s name. Using the `d3.geoPath` projection and a `geoNaturalEarth1` projection, it renders geographic features from the `world-atlas` TopoJSON and TSV data sources. The visualization incorporates the `zoom` interaction module from D3’s `d3.zoom` API, enabling users to pan and scale the map via mouse events. It employs SVG rendering for vector-based output.
AI-generated descriptionMIT Licensed




Comments
Sign in to join the discussion.