🌍 Public
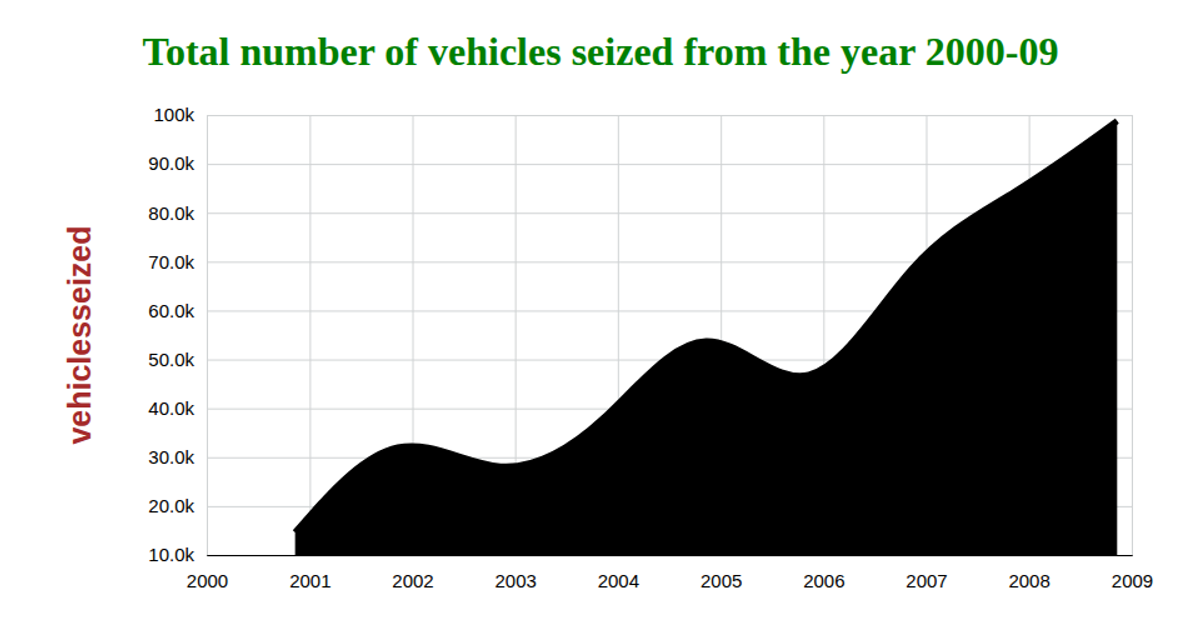
ICE 7 question 3-Line chart
This line chart displays the total number of vehicles seized annually from 2000 to 2009, with the year on the x-axis and the seizure count on the y-axis. The visualization uses D3 v5’s `scaleTime` and `scaleLinear` for axes, `axisBottom` and `axisLeft` for ticks, and a `line` generator to draw the path. Data is loaded from a remote CSV via `d3.csv`, with dates parsed using `d3.timeParse`. The SVG rendering includes gridlines and axis labels, styled through CSS.
AI-generated descriptionMIT Licensed




Comments
Sign in to join the discussion.