🌍 Public
ICE 7 line chart bhargava
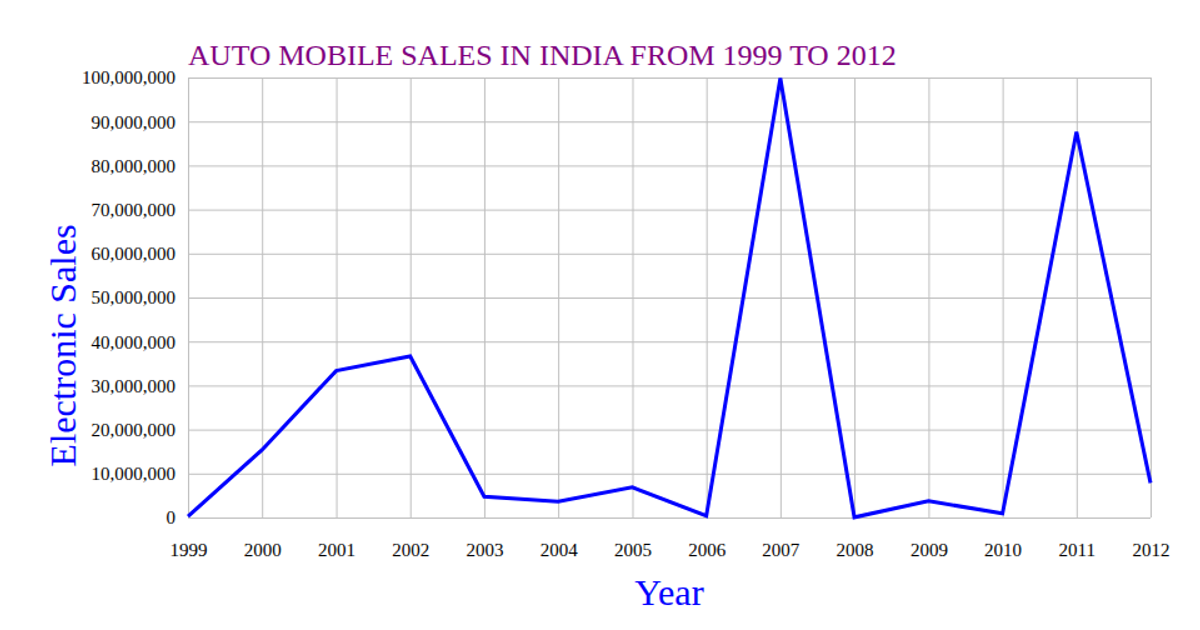
This visualization displays annual vehicle sales in India from 2010 to 2020 using a line chart. The chart plots years on the x-axis and sales figures on the y-axis, with both axes labeled and styled. The SVG rendering uses D3’s `scaleTime` and `scaleLinear` for axes, `axisBottom` and `axisLeft` for tick marks, and `line` to generate the path. Data is loaded from a remote CSV file via `csv`, with sales parsed as numbers and years converted to `Date` objects.
AI-generated descriptionA bare minimum HTML page demonstrating use of CSS and JavaScript.
See also React Starter.
MIT Licensed


Comments
Sign in to join the discussion.