🌍 Public
Fork of RC 007 Bar Chart of stock data
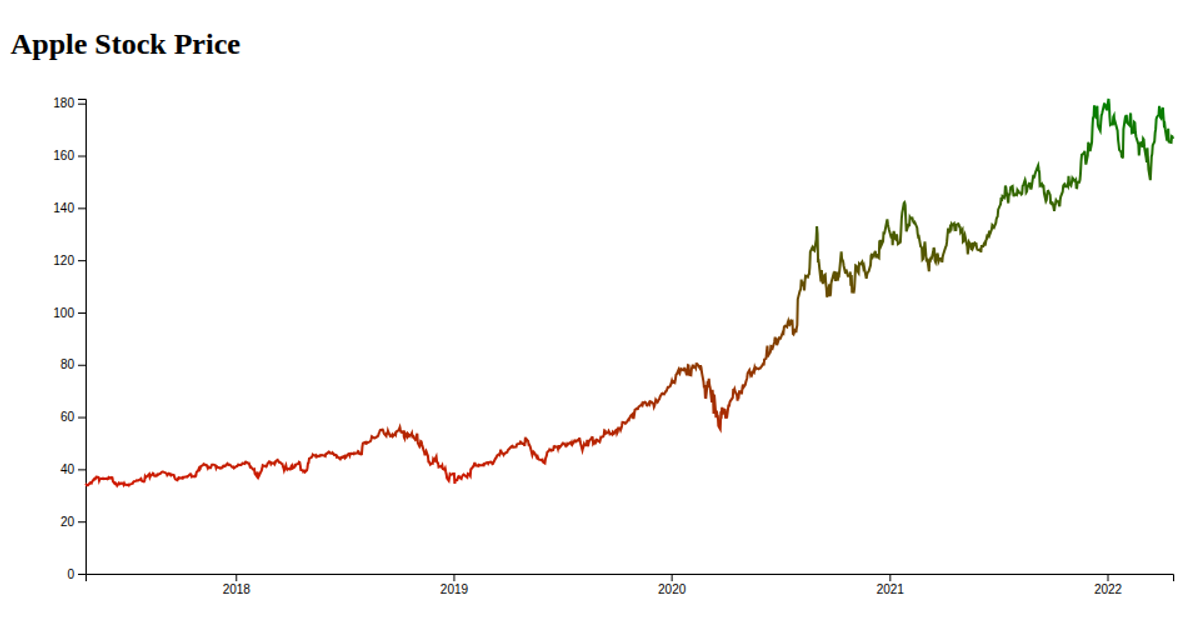
This fork of the Observable bar chart shows Amazon (AMZN) stock price and trading volume on a dual-axis, zoomable SVG chart. The visualization combines a steelblue volume bar series with an orange price line, plus a final price point marker and an interactive data table. It uses d3.csvParse to load data from a gist, then d3.scaleTime, d3.scaleLinear, d3.axisBottom, d3.axisLeft, and d3.axisRight to render the axes and grid lines.
AI-generated descriptionMIT Licensed





Comments
Sign in to join the discussion.