🌍 Public
Fork of RC UNT Fork of Stylised Bar chart
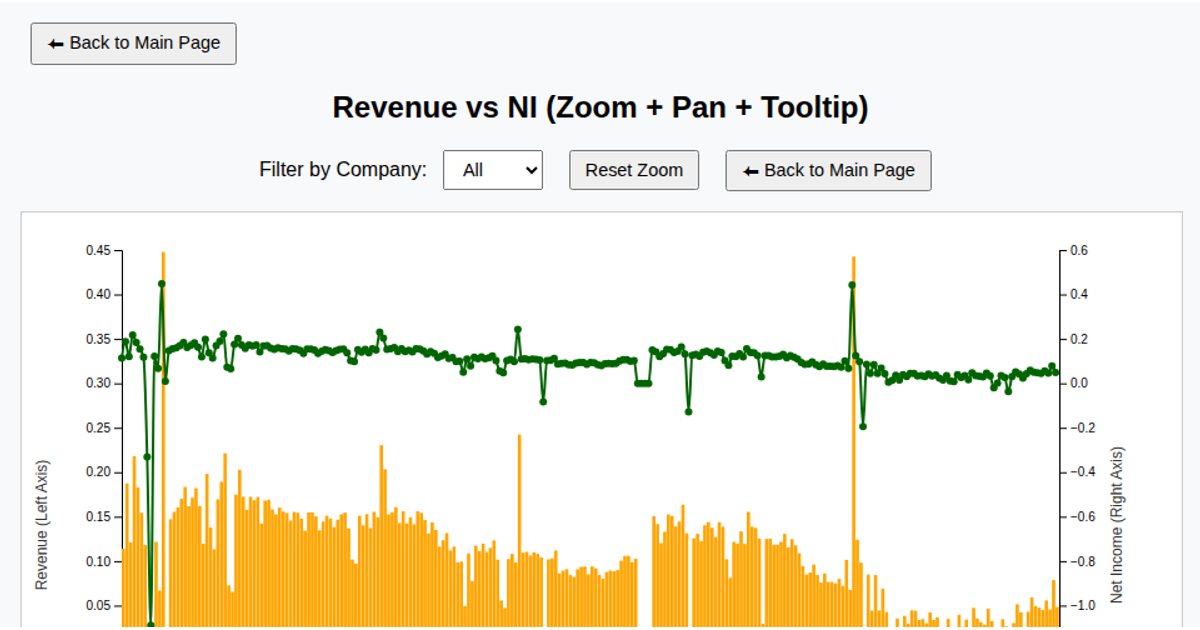
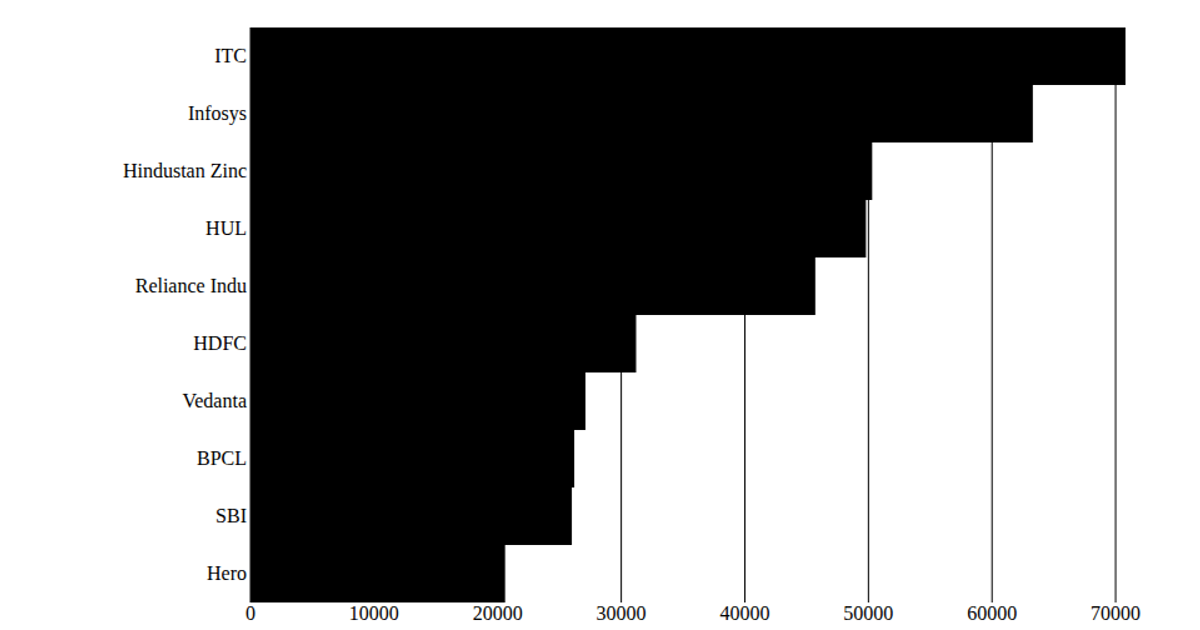
This interactive React dashboard visualizes financial ratios by combining a bar chart of asset turnover with a tooltip-driven interface. Data is loaded via `d3.csv` from a GitHub gist containing quarterly financial ratios. Users can filter by company using a dropdown menu and reset zoom on both charts. The bar chart uses `d3.axisBottom`, `d3.axisLeft`, and `scaleLinear` for positioning, with hover effects changing bar color. A second scatter plot appears to be included but is initialized without visible rendering logic in the provided code.
AI-generated descriptionMIT Licensed





Comments
Sign in to join the discussion.