🌍 Public
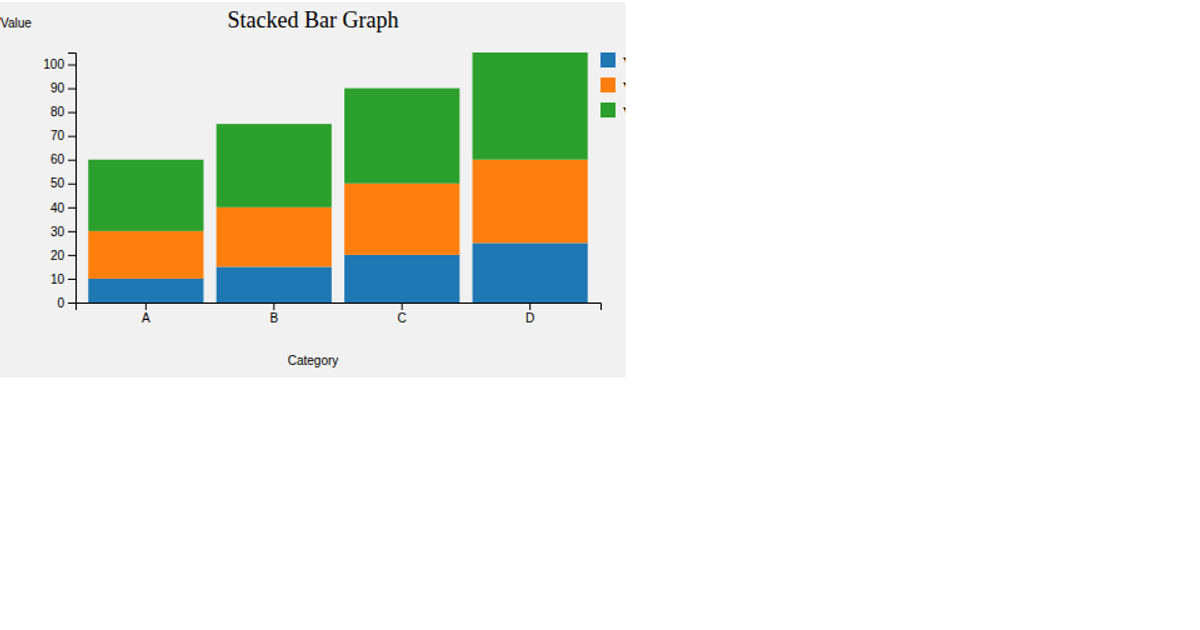
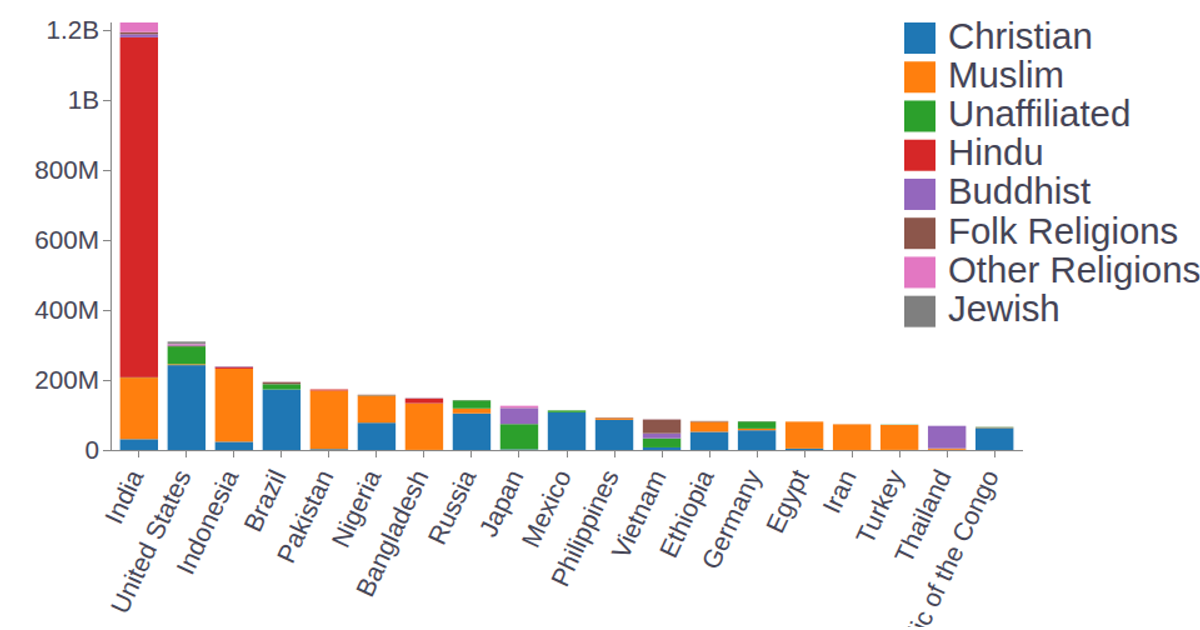
Example stacked barplot
This stacked barplot visualizes the distribution of award recipients by country and year, with each bar segment representing a different place and the full bar height indicating the total number of awards. The chart uses D3.js v3 with SVG rendering and animation, employing `d3.time.scale`, `d3.scale.ordinal`, `d3.svg.axis`, and `d3.layout.stack` to build the layers. A tooltip appears on hover, and the data comes from the awards.csv file, with colors assigned via a predefined palette in the color range array.
AI-generated descriptionMIT Licensed





Comments
Sign in to join the discussion.