🌍 Public
Interactive Stacked Bar Chart for Nobel Prizes
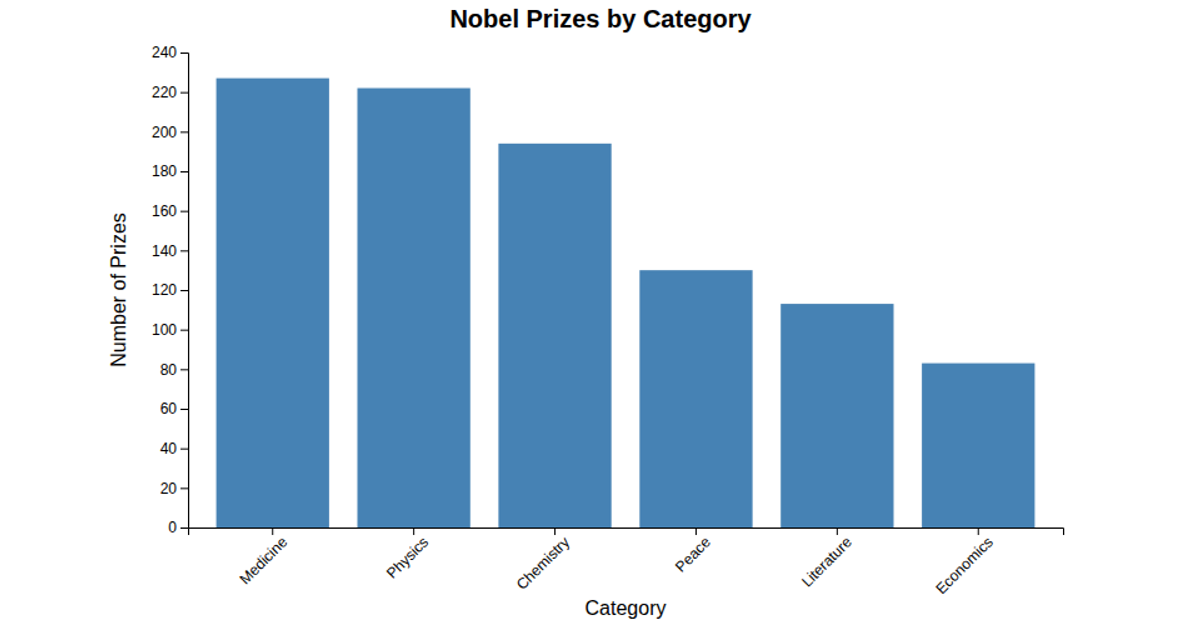
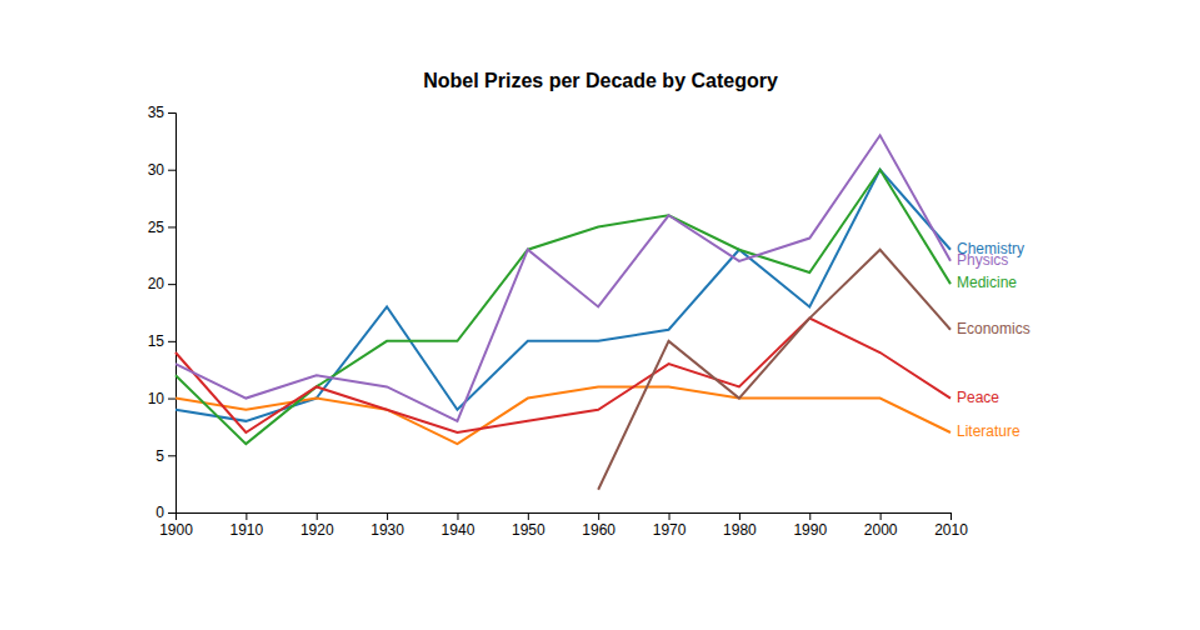
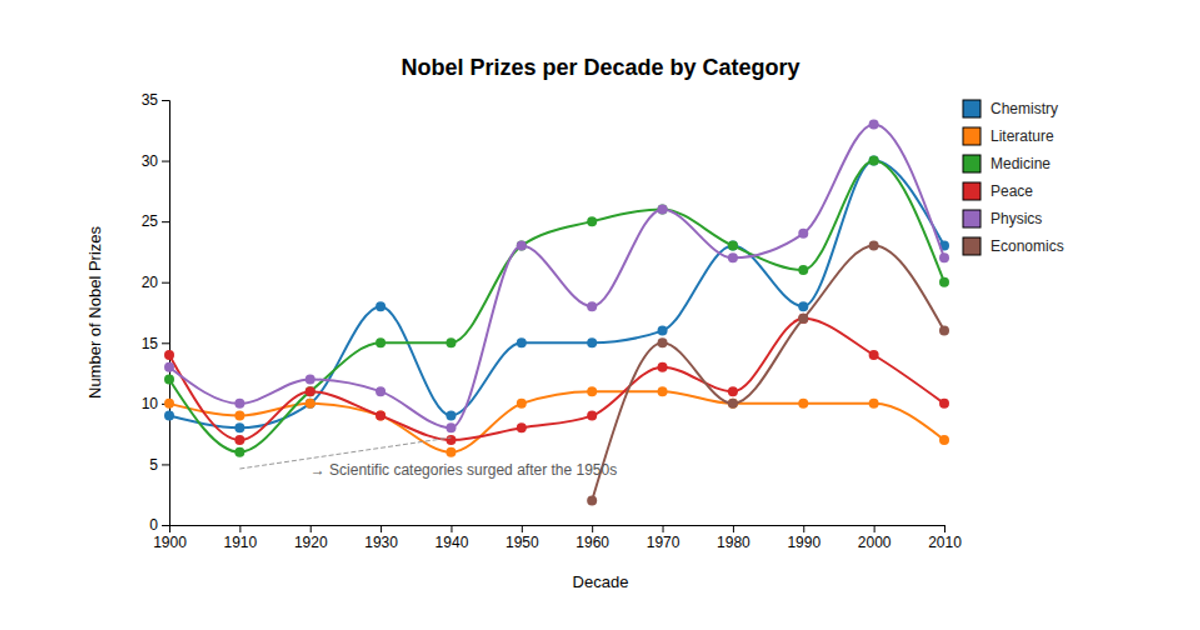
The interactive stacked bar chart visualizes Nobel Prize counts by category across 10-year periods, using color coding to distinguish disciplines. Hovering a category in the color legend highlights its corresponding stack segments while fading others. Built with Vue and WebGL, it processes the Nobel dataset with `rollup` aggregation, `stack()` for stacking categories, and `scaleBand`/`scaleLinear` for axes. The `colorLegend` module manages interactive hover states, applying opacity and stroke effects via D3 selections.
AI-generated descriptionMIT Licensed




Comments
Sign in to join the discussion.