🌍 Public
DF Dispatches 2018
NNiall O'Brien
Last edited Dec 15, 2019
Created on Nov 26, 2019
Forked from Temperature in San Francisco: line charts
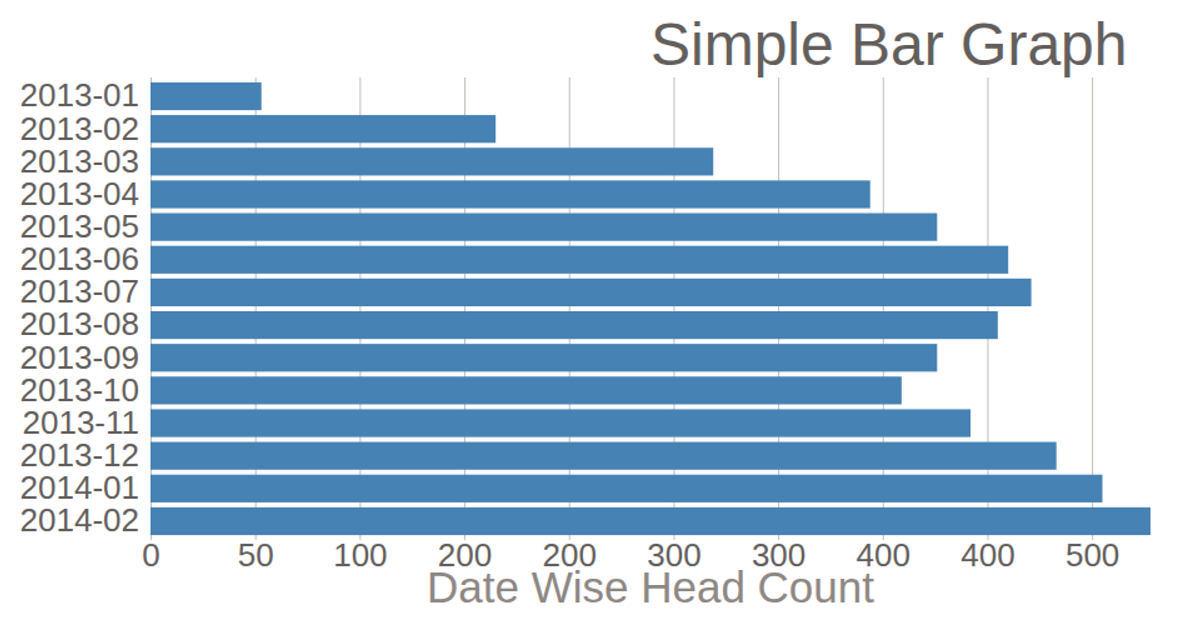
The visualization shows the number of Dublin Fire Brigade dispatches per month in 2018, plotted as a line chart with month on the x-axis and call volume on the y-axis. The data reveals a spike in July and October, with relatively lower counts in February. The chart is rendered as an SVG using D3 v5, with `d3.scaleLinear` for both axes, `d3.line` with `curveLinear` for the path, and `d3.axisLeft` and `d3.axisBottom` for ticks. Data is loaded from a CSV file using `d3.csv`.
AI-generated descriptionA line chart representing number of Dublin Fire dispatches in 2013 per month.
MIT Licensed


Comments
Sign in to join the discussion.