🌍 Public
Scatter Plot
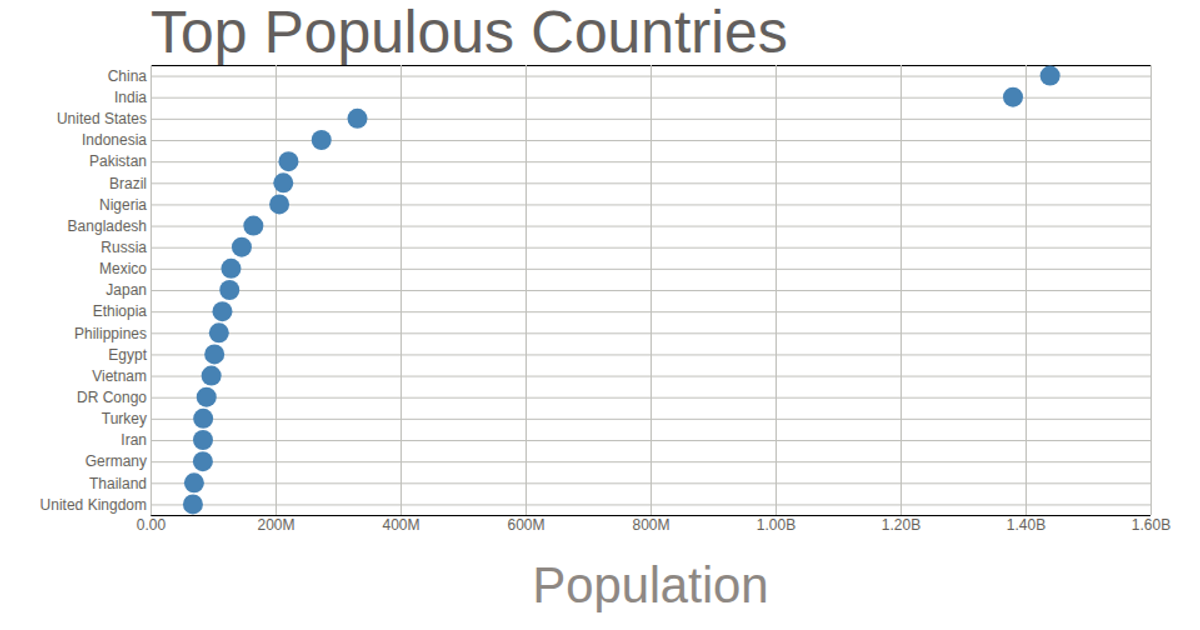
This scatter plot displays the top 21 most populous countries, with each circle positioned along a linear population scale and a categorical country axis. The chart loads data from a CSV file and renders circles using D3 selections, scaled with `scaleLinear` and `scalePoint`. Axes are generated via `axisBottom` and `axisLeft`, with tick lines extending across the plot. The population axis uses a custom tick formatter to abbreviate large numbers, while the plot is styled with SVG and CSS.
AI-generated descriptionMIT Licensed


Comments
Sign in to join the discussion.