🌍 Public
Fork of Label Filtering Algorithm Prototype
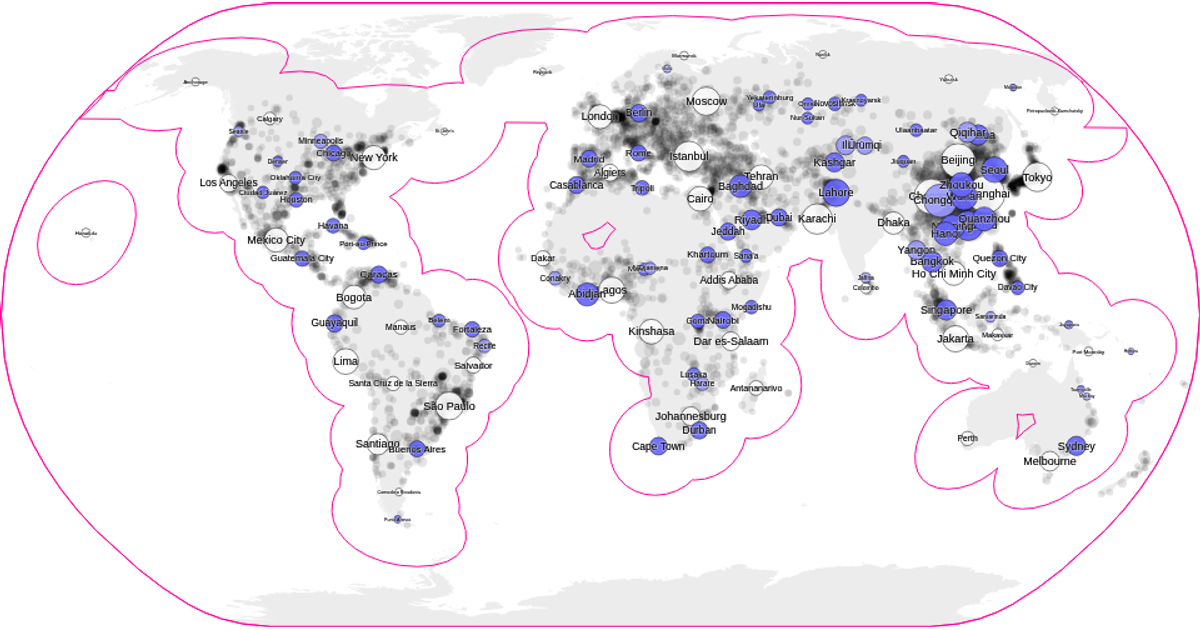
This visualization demonstrates a label placement algorithm for maps and scatter plots, showing city names positioned without overlapping. It projects world cities using a Natural Earth projection and renders population density as colored contours. The code uses D3 methods like `geoNaturalEarth1`, `contourDensity`, and `scaleSequential` for the map, while collision detection relies on the RBush spatial index. Labels are filtered by population threshold and hidden when their bounding boxes intersect, with data from the visionscarto-world-atlas and worldcitiesReduced datasets.
AI-generated descriptionA proof of concept for a label placement algorithm that can be used to add labels to maps and scatter plots.
MIT Licensed



Comments
Sign in to join the discussion.