🌍 Public
activity6_Task 5
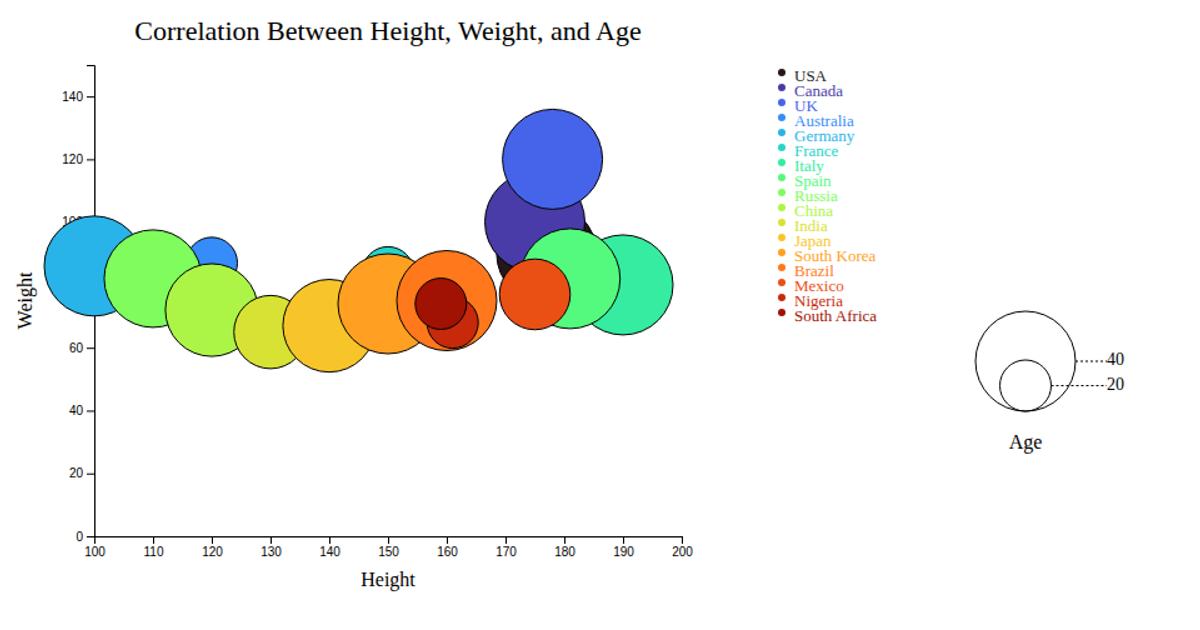
This bubble chart visualizes the correlation between primary language, country, and category for major YouTube channels. The chart displays circles on a scatter plot, where the x-axis represents average country metrics and the y-axis represents average language metrics. Circle size encodes a third variable, while color distinguishes different channel categories. The visualization uses d3.scaleLinear for axes and bubble sizing, d3.scaleOrdinal for color mapping with interpolateTurbo, and includes interactive tooltips on mouseover events. Data is loaded from a GitHub-hosted CSV file, with the chart rendered as SVG with animated transitions.
AI-generated descriptionAn example showing the capabilities of VizHub:
- Loads D3 via UNPKG.
- Demonstrates use of
importfrom"d3". - Demonstrates use of
importfrom local ES6 modules.
MIT Licensed



Comments
Sign in to join the discussion.