🌍 Public
Activity 6 Task 4
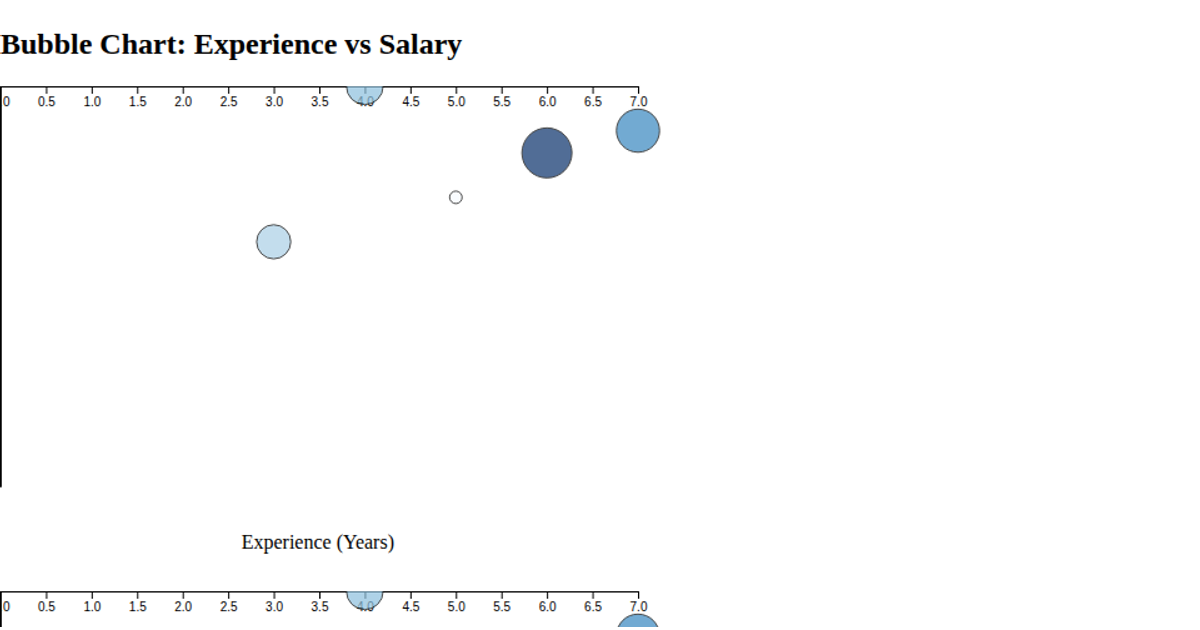
This bubble chart visualizes the popularity, average salary, and job postings for various programming languages. It encodes popularity on the x-axis, salary on the y-axis, and the number of job postings as the size of each bubble, with colors distinguishing each language. The visualization is built with D3 v7, using `d3.scaleLinear` for axes and bubble sizing, and `d3.schemeCategory10` for color assignment. Interactive tooltips appear on hover, displaying the exact values for each language. The data is loaded from a CSV file.
AI-generated descriptionMIT Licensed



Comments
Sign in to join the discussion.