🌍 Public
Untitled
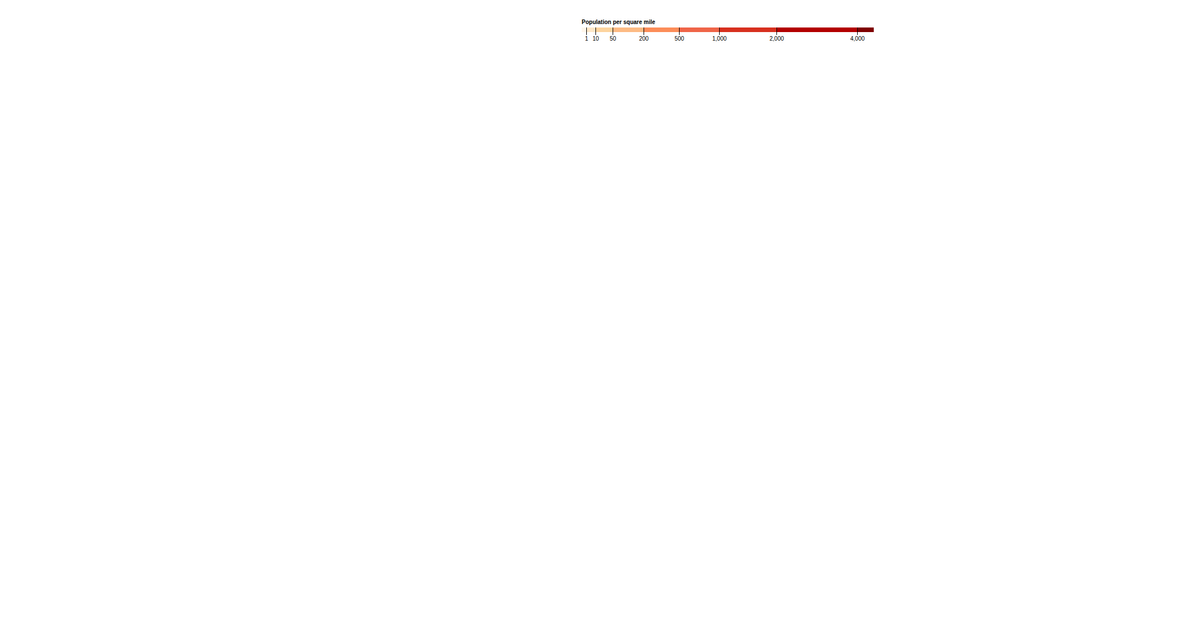
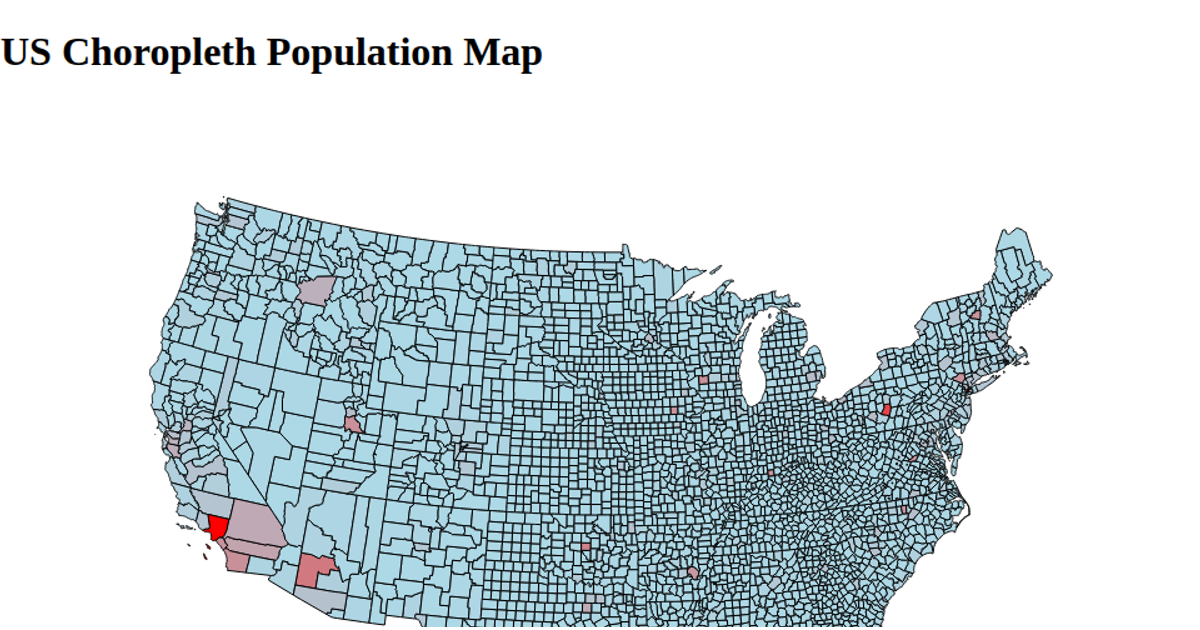
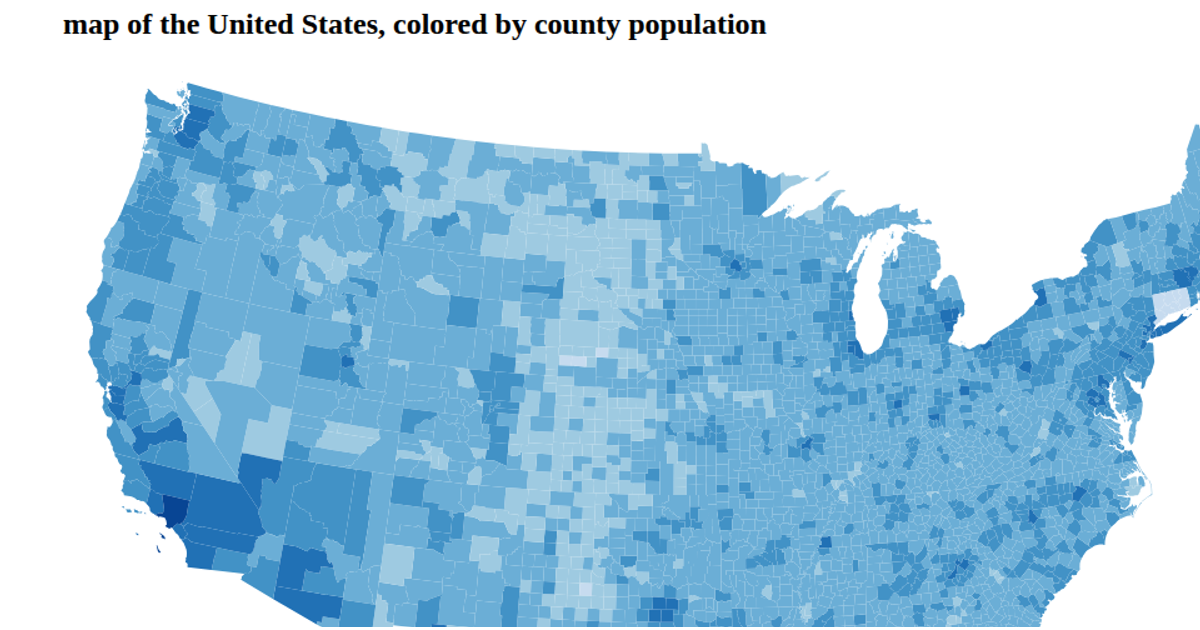
A choropleth map of population density by census block group uses a sequential color scale from the d3-scale-chromatic library to shade geographic regions. The visualization renders as SVG via d3.geoPath, with a threshold scale mapping density values to the OrRd color scheme and a legend using d3.axisBottom. It loads TopoJSON data containing block group polygons, fills each path according to its population per square mile, and outlines counties with a subtle stroke. The code applies d3.scaleThreshold and d3.scaleSqrt to encode the data range.
AI-generated descriptionMIT Licensed





Comments
Sign in to join the discussion.