🌍 Public
d3 Choropleth map
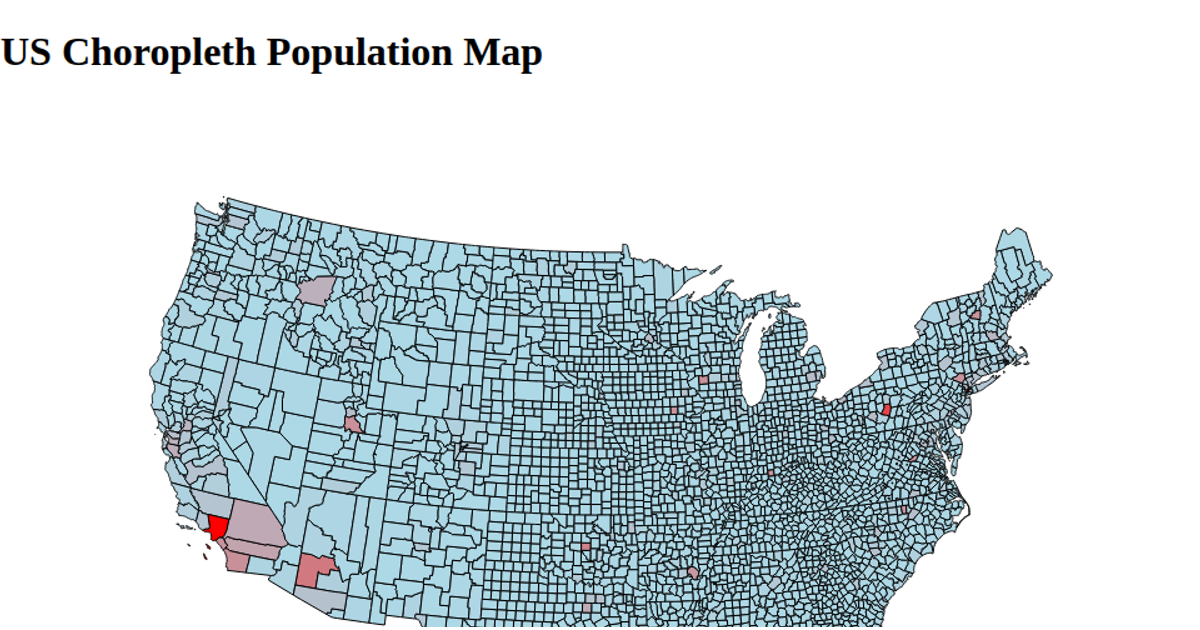
This choropleth map shows U.S. counties colored by their 2023 population estimates, using a logarithmic threshold color scale with seven blues to reveal regional population patterns. It loads population data from a CSV and county boundaries from a TopoJSON file via Promise.all, then renders the map using d3.geoPath on SVG paths. The fill color is assigned per county using d3.scaleThreshold and FIPS codes, with a d3.legendColor legend and a title clarifying the data shown.
AI-generated descriptionMIT Licensed





Comments
Sign in to join the discussion.