🌍 Public
Countries Population Visualization
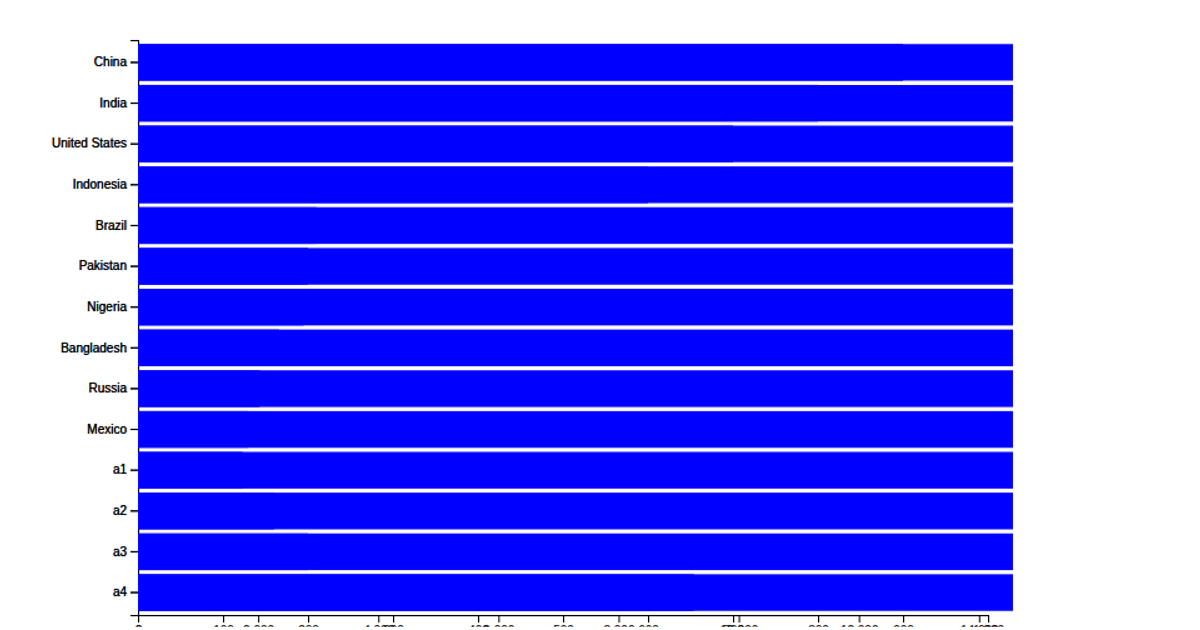
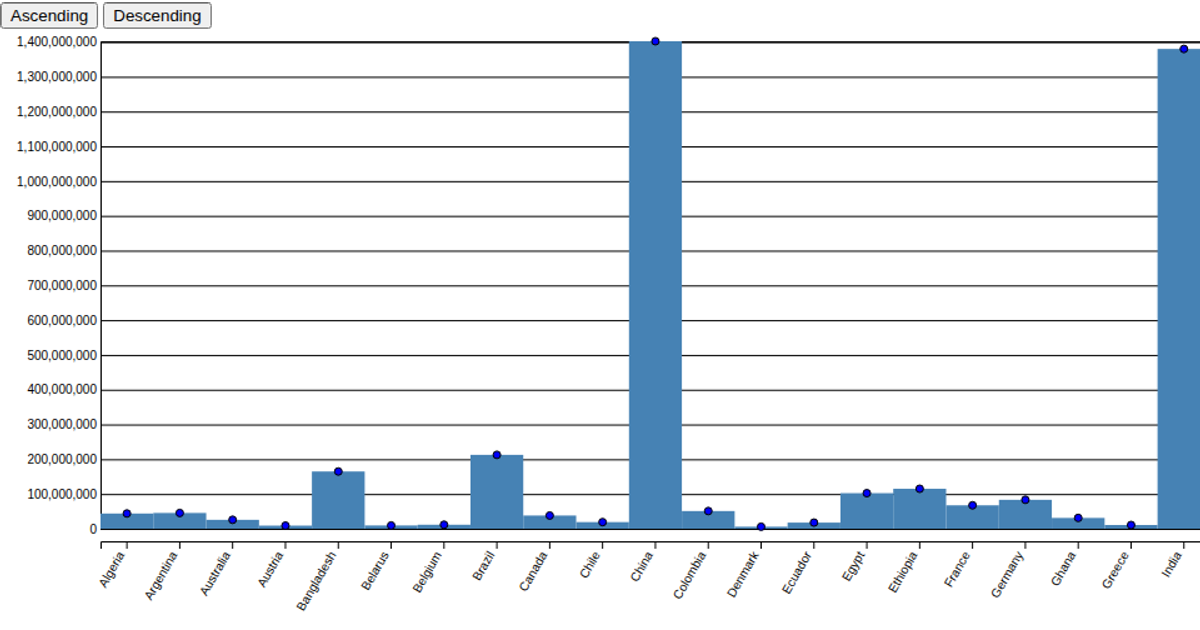
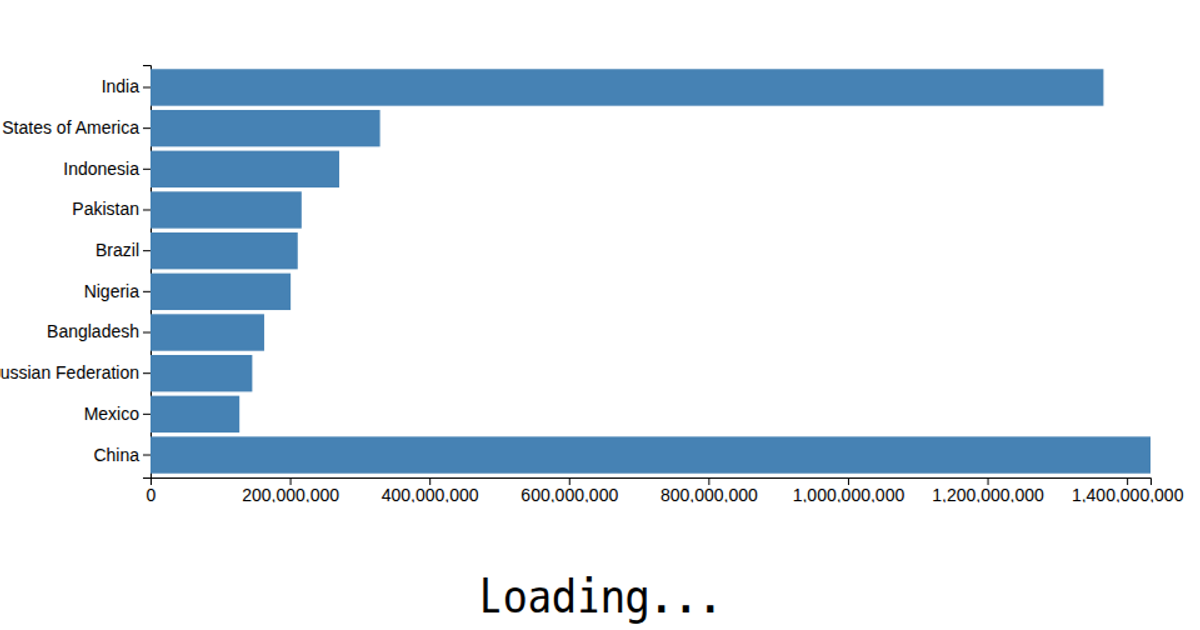
This visualization shows the population of various cities using a horizontal bar chart, with each bar’s length proportional to the city’s population. The data is loaded from a CSV file and rendered as SVG rectangles using D3 v5’s `scaleLinear`, `scaleBand`, and `csv` methods. The chart displays the city names on the y-axis and population values on the x-axis, with bars styled without axis labels or gridlines.
AI-generated descriptionMIT Licensed




Comments
Sign in to join the discussion.