🌍 Public
Github activity overview
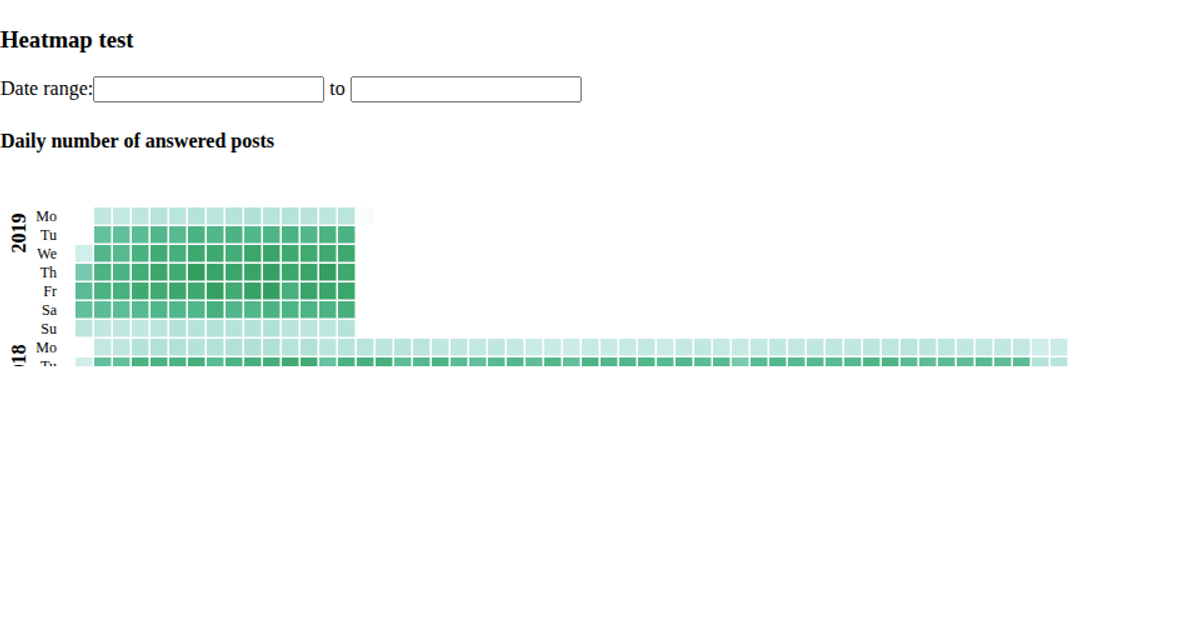
This example simulates a GitHub contribution heatmap, displaying 365 days of activity as a grid of colored squares. Each square’s color encodes a random activity value from 0 to 9, using a linear scale with an RGB interpolator that transitions from light gray to green; zero-value days appear in light gray. Hovering over a square reveals its value in a tooltip positioned near the cursor. The visualization is built with D3 v5, using `d3.select`, `d3.scaleLinear`, `d3.interpolateRgb`, and `d3.randomInt` to generate and render the data.
AI-generated descriptionA simulation of Github activity overview
MIT Licensed




Comments
Sign in to join the discussion.