🌍 Public
Stack Overflow - Calendar Heatmap
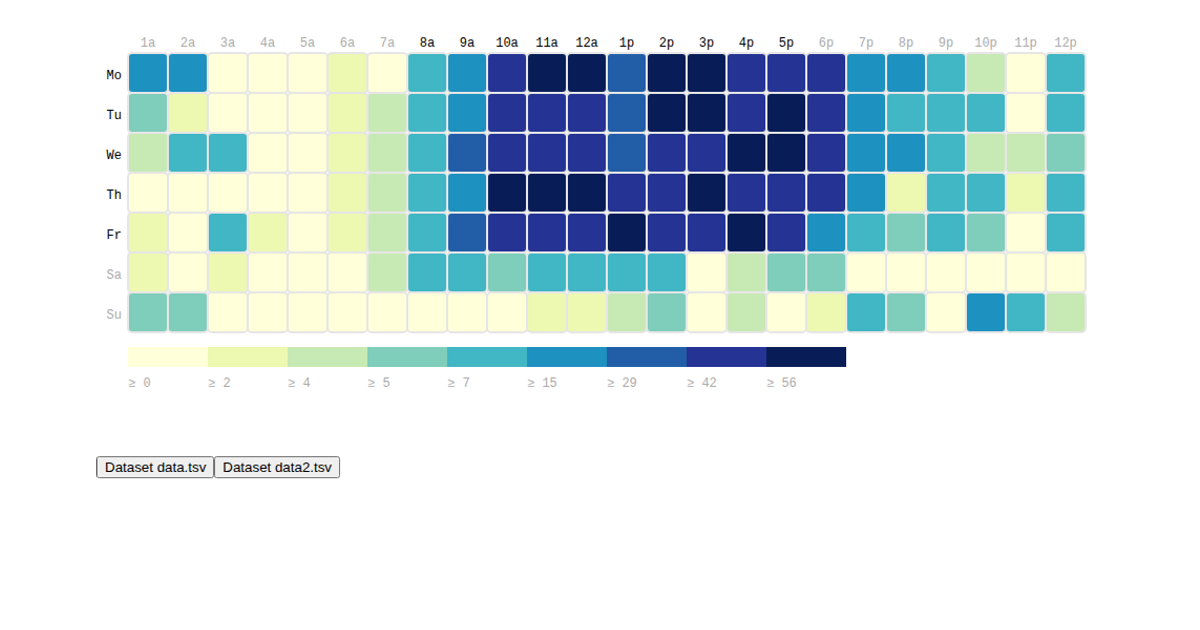
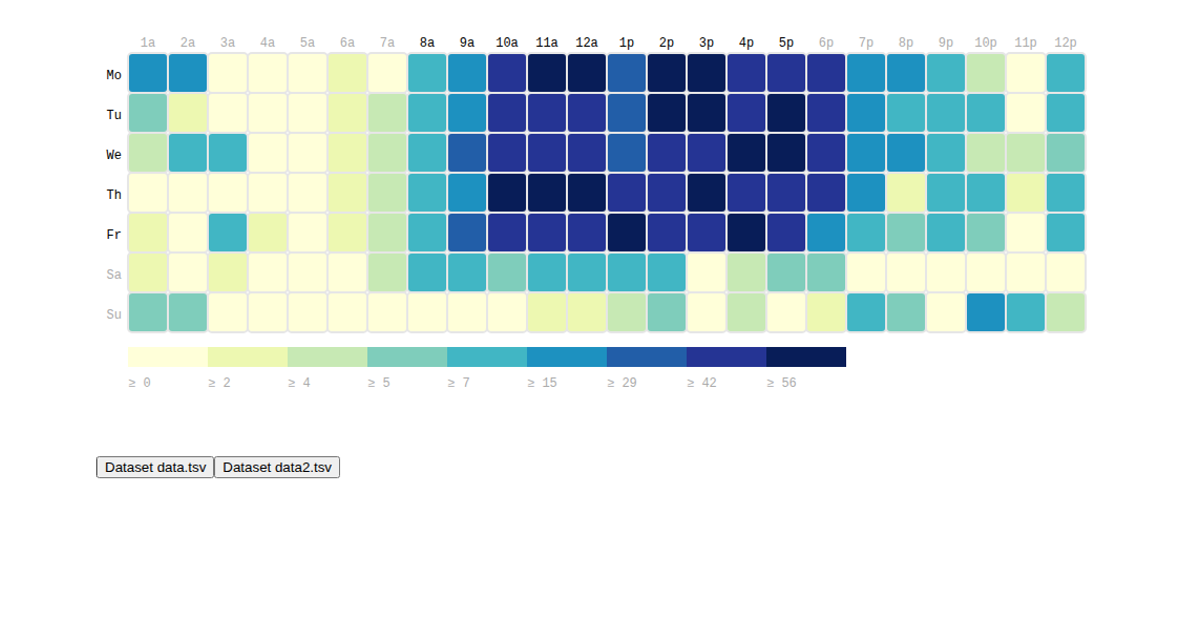
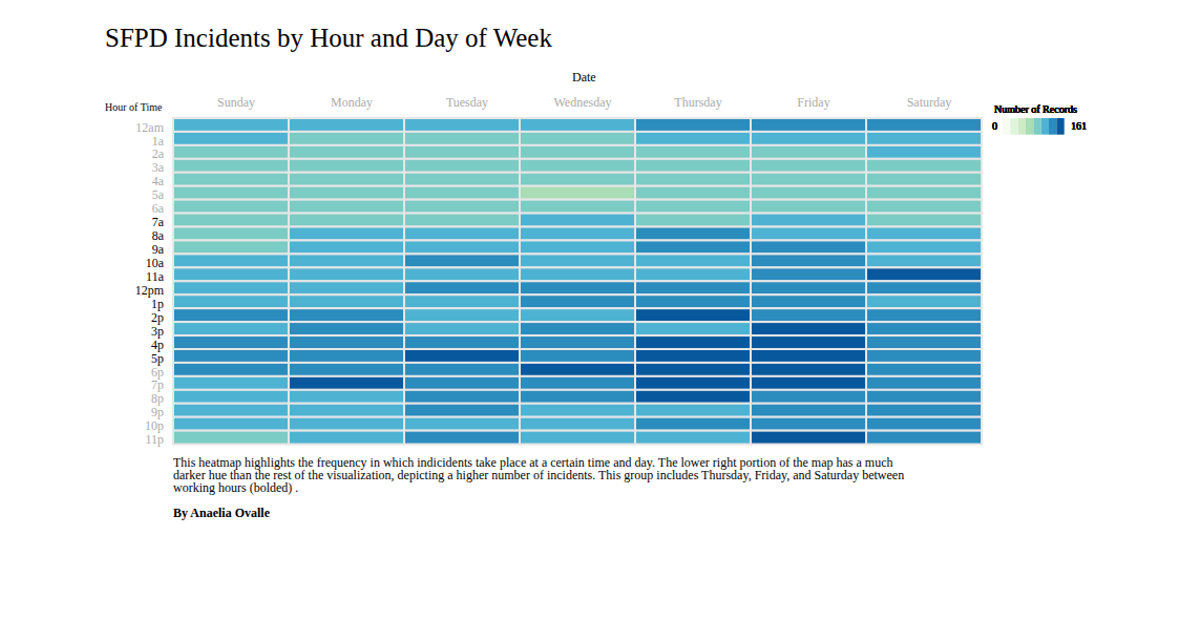
This example displays the daily number of answered posts on Stack Overflow as a calendar heatmap, using a color scale to represent the intensity of activity across dates. The code is built with D3.js v5, using `scaleLinear` and `scaleBand` to render rectangles within an SVG, and includes date-range pickers via the TheDatepicker and jQuery UI libraries for interactive filtering. The data consists of a sample CSV with date and answer count pairs, which are mapped to the heatmap grid for visualization.
AI-generated descriptionMIT Licensed




Comments
Sign in to join the discussion.