🌍 Public
Fork of Missing Migrants
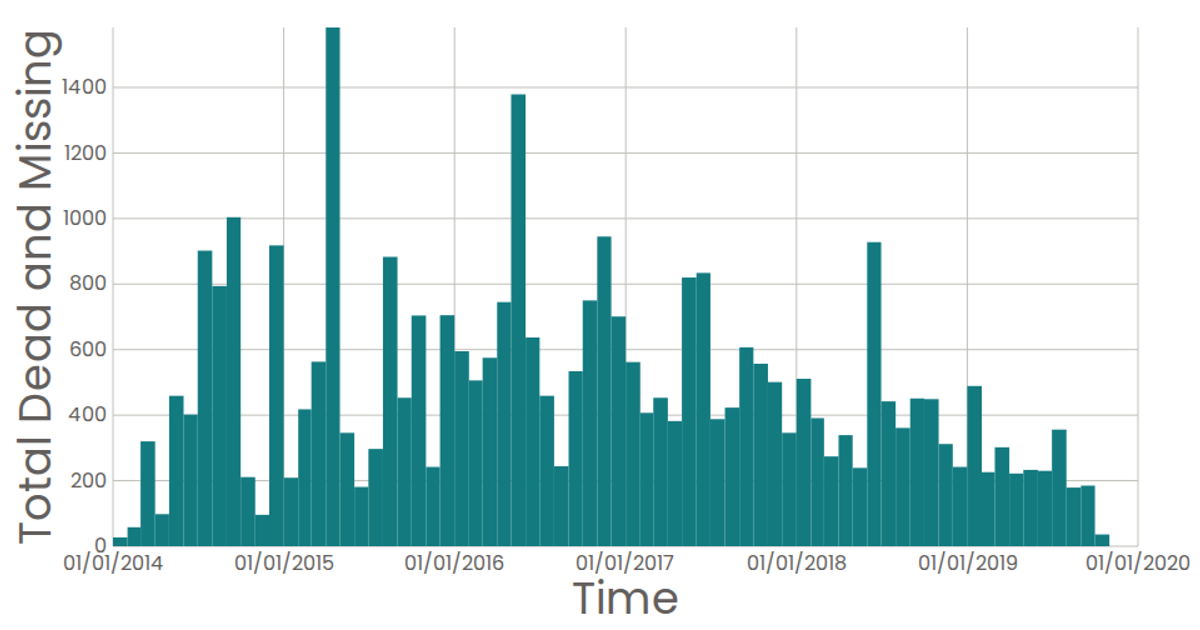
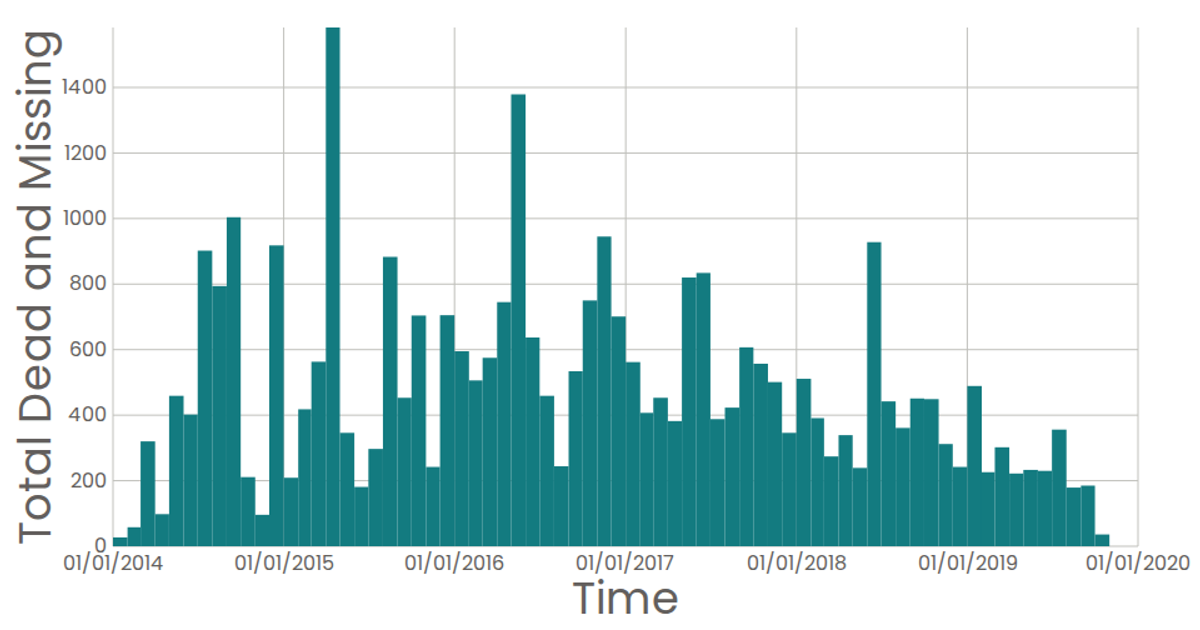
This chart visualizes the Missing Migrants dataset, showing the total number of dead and missing migrants binned by reported date. It aggregates individual events into monthly totals, rendering a bar chart with D3’s `histogram` and `scaleTime` APIs, with React and SVG for the interface. The bars are colored teal, and hovering reveals the exact count via a tooltip. Data is sourced from a CSV loaded using D3’s `csv` function.
AI-generated descriptionA scatter plot of the Missing Migrants Dataset.
Each point in the plot represents a single event.
MIT Licensed





Comments
Sign in to join the discussion.