🌍 Public
Axis Padding Concept
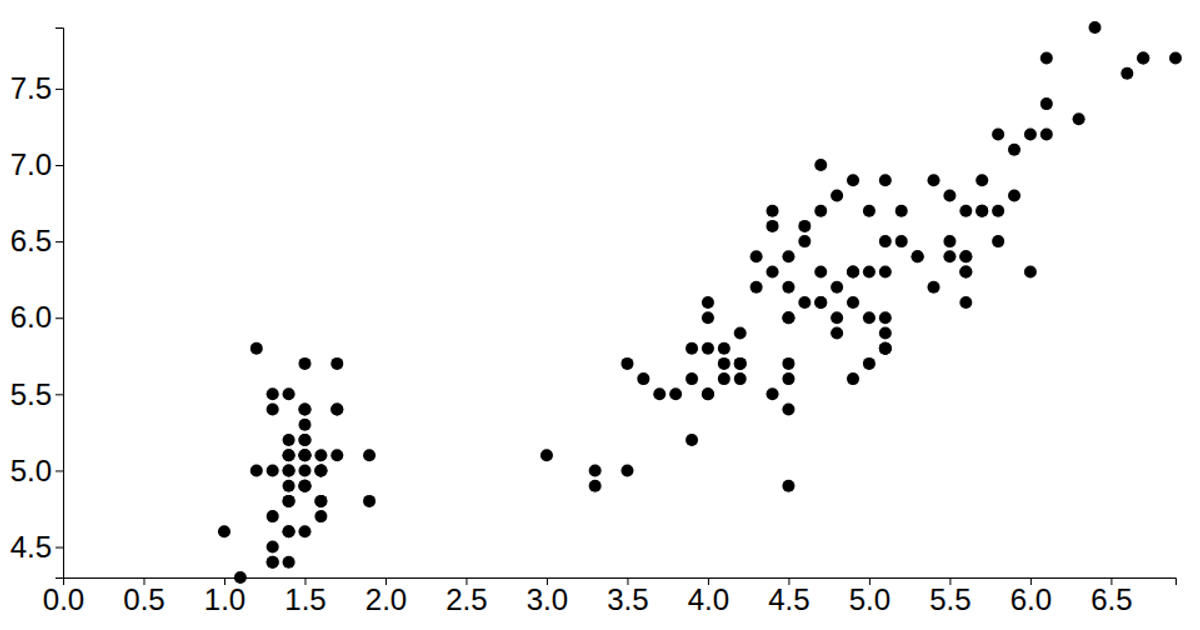
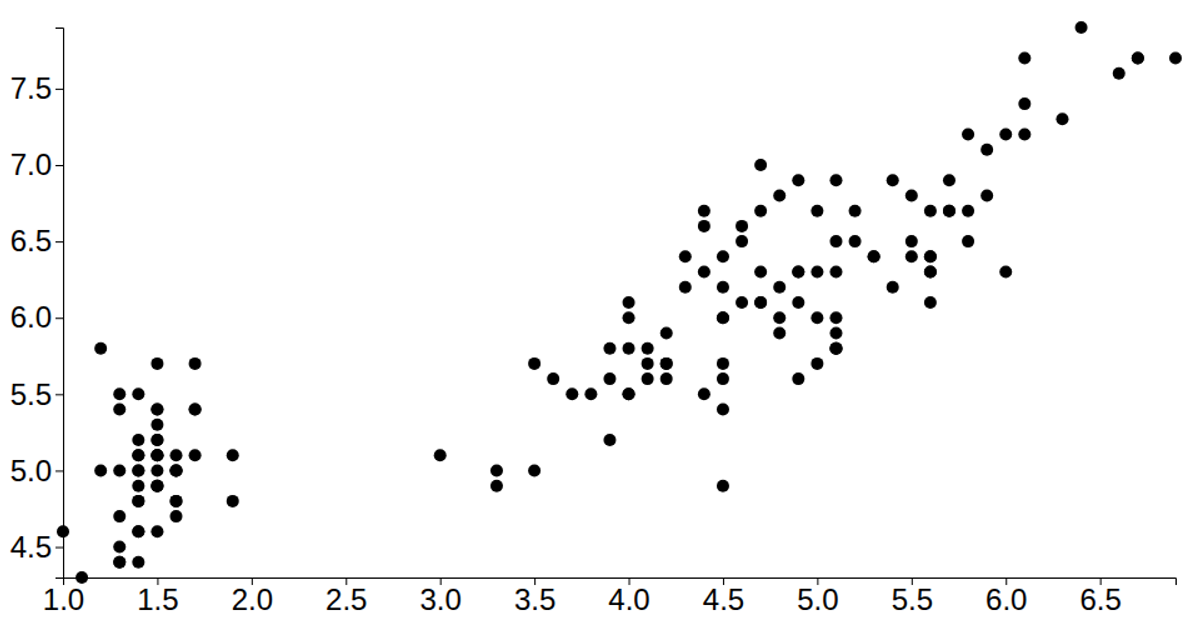
This example demonstrates how to offset axes away from data points so that scatterplot circles do not overlap the domain lines. It loads the Iris flower dataset from a CSV file, scales petal length and sepal length using `d3.scaleLinear`, and renders circles as SVG elements. The left and bottom axes are drawn with `d3.axisLeft` and `d3.axisBottom`, shifted by a constant `axisPadding` value via SVG `transform` attributes, while the tick text is styled with a larger font size. The visualization updates to fill the browser window.
AI-generated descriptionA demonstration of how to move axes a bit out of the way so that the points don't fall on the domain lines.
Related: d3-scale: Pad domain addition? .
MIT Licensed



Comments
Sign in to join the discussion.