🌍 Public
Flower Scatter plot
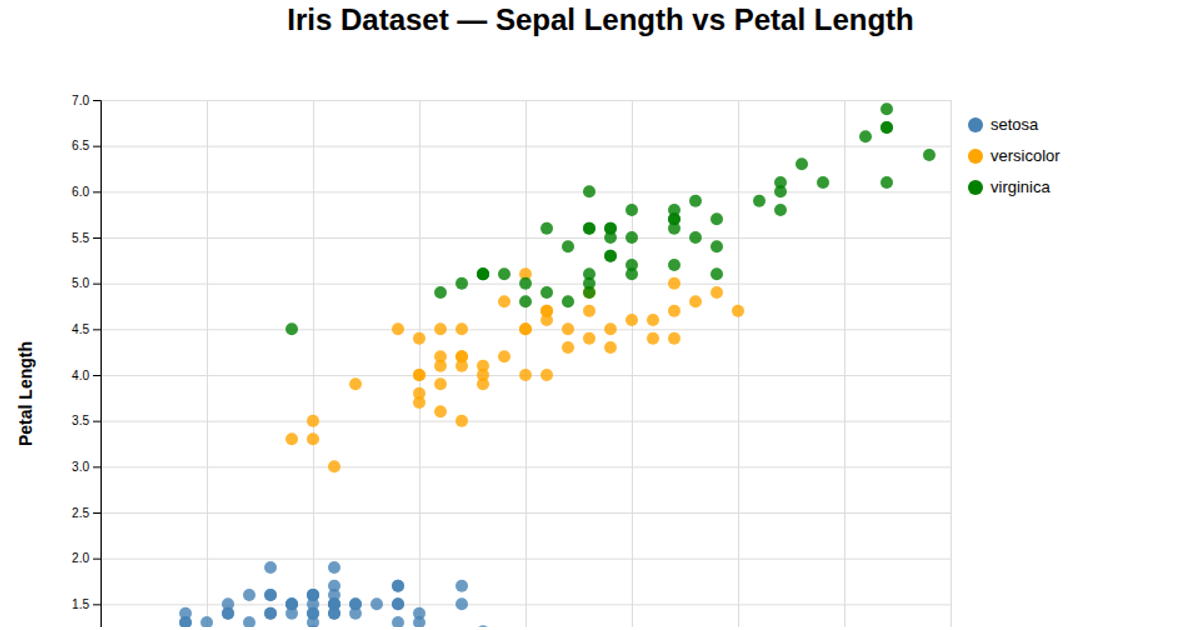
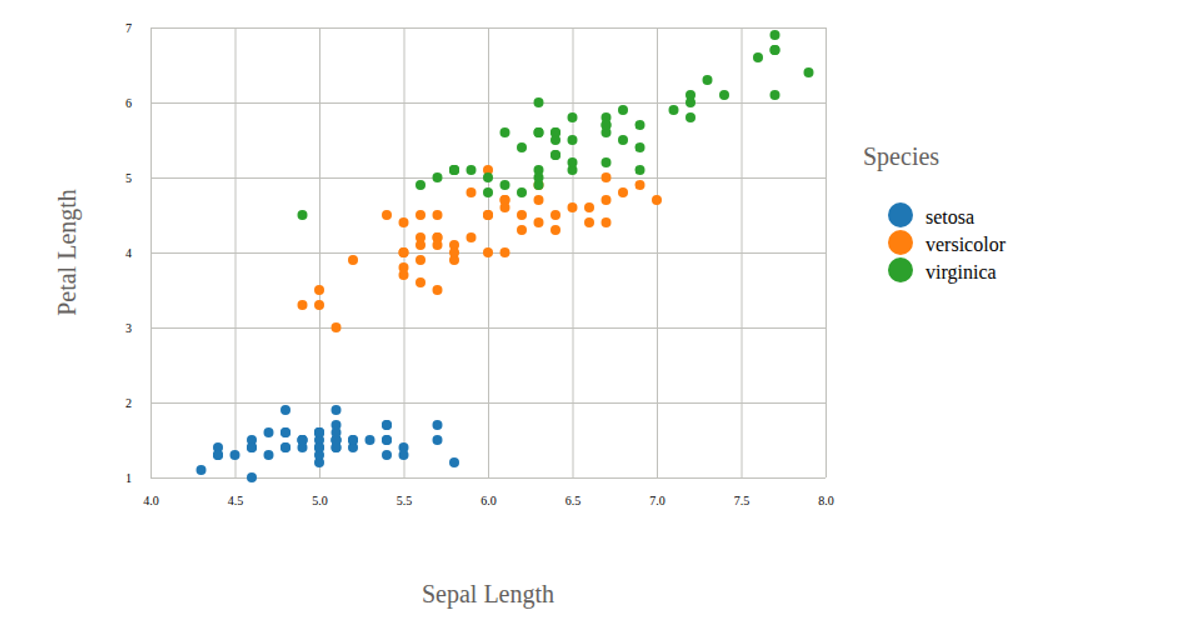
A flower scatter plot displays HeightCM against SizeIndex, with points colored by Species from a CSV dataset. Rose, hibiscus, and shoeblack plant observations are jittered horizontally within size bands to reduce overlap, and the legend identifies each species. The visualization uses d3.csv, d3.scaleBand, d3.scaleLinear, and d3.scaleOrdinal with the Set2 color scheme, rendering circles in SVG with hover outlines.
AI-generated descriptionMIT Licensed





Comments
Sign in to join the discussion.