🌍 Public
Scatter Plot with Color and Size
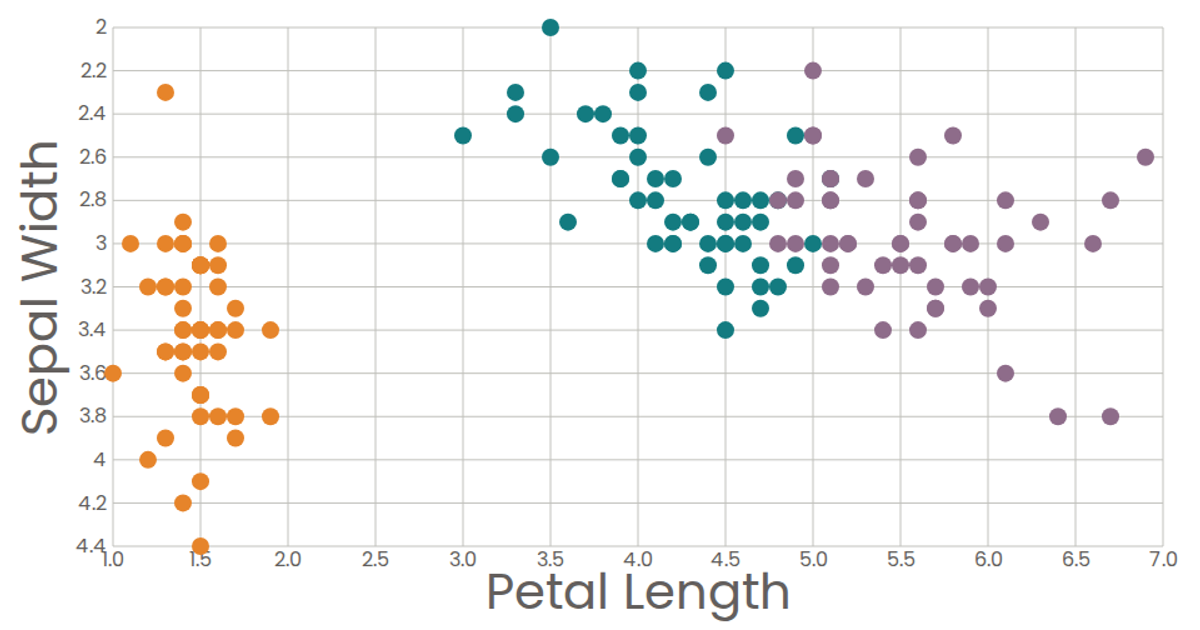
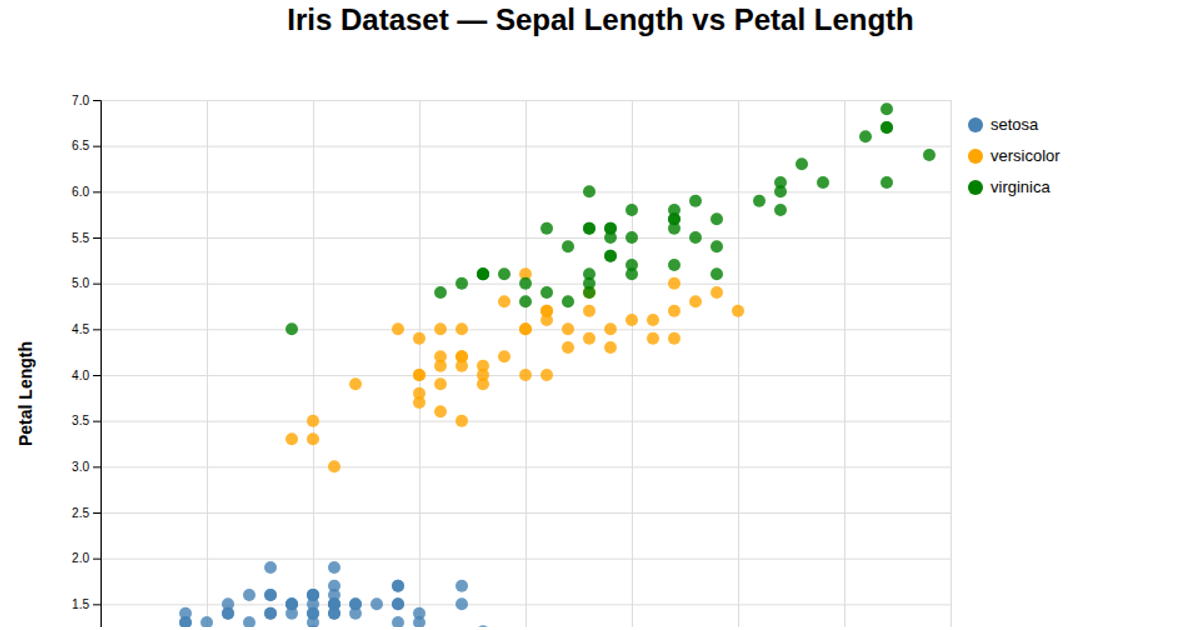
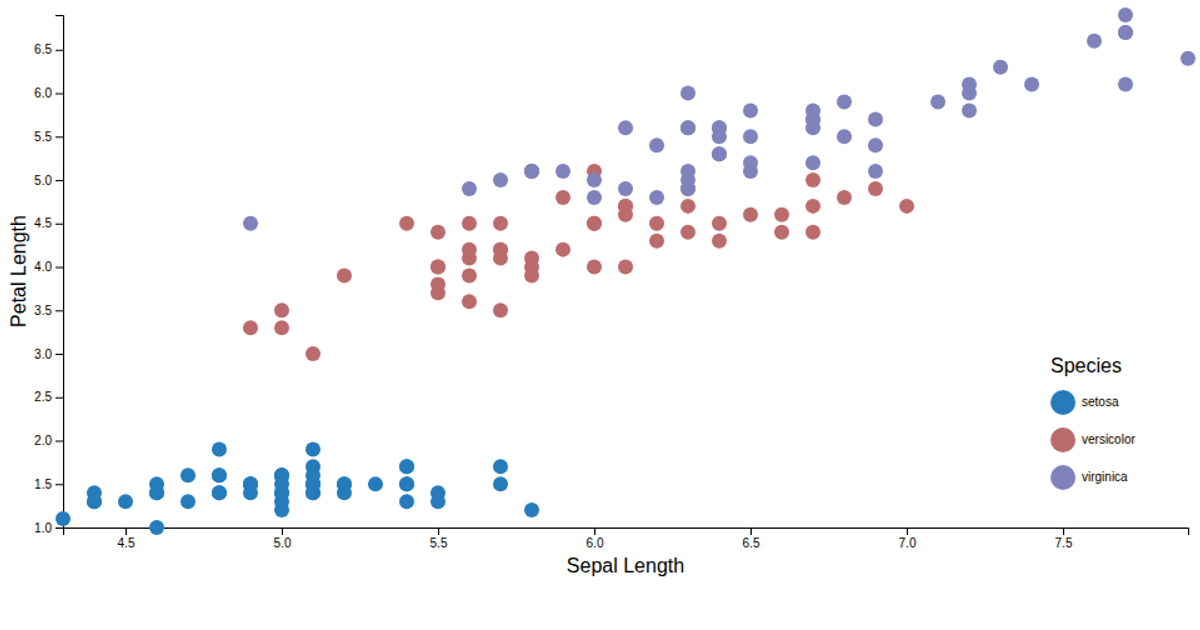
This scatter plot visualizes the Iris dataset, displaying petal length and width on the x- and y-axes while encoding sepal length through point size and species through color. The D3 v7 code uses `d3.csv` with `d3.autoType` to load data, then `d3.scaleLinear` for axes, `d3.scaleOrdinal` for categorical colors, and `d3.scaleSqrt` to map a third continuous variable to circle radius. Hover tooltips provide exact values for all four measurements per flower.
AI-generated descriptionMIT Licensed



Comments
Sign in to join the discussion.