🌍 Public
activity6_question2
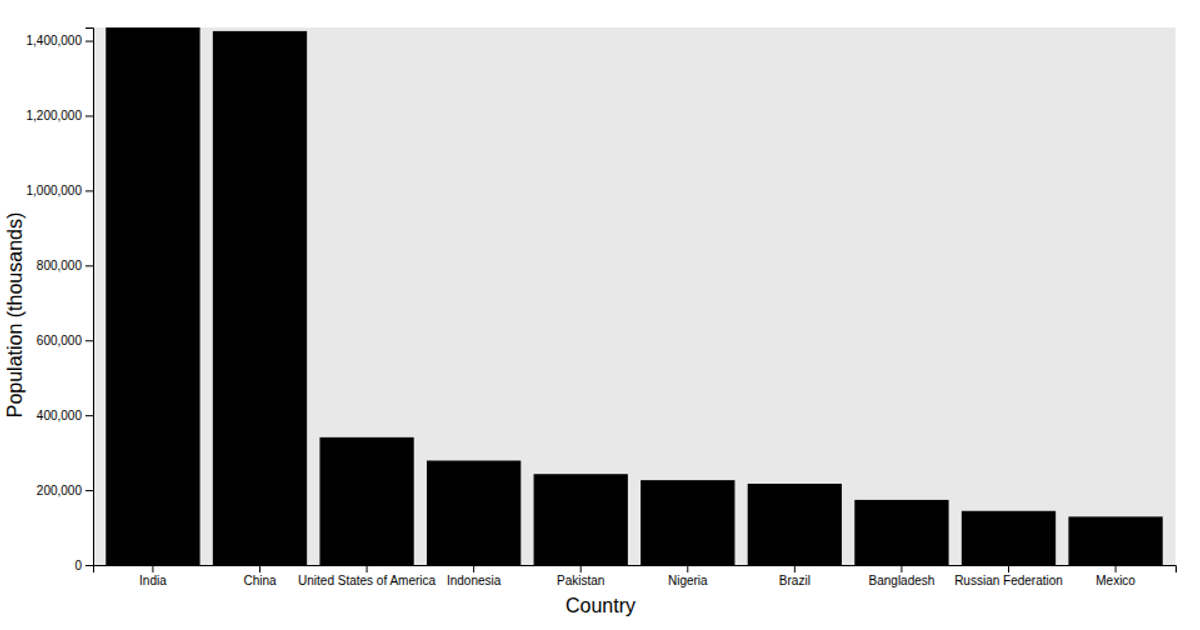
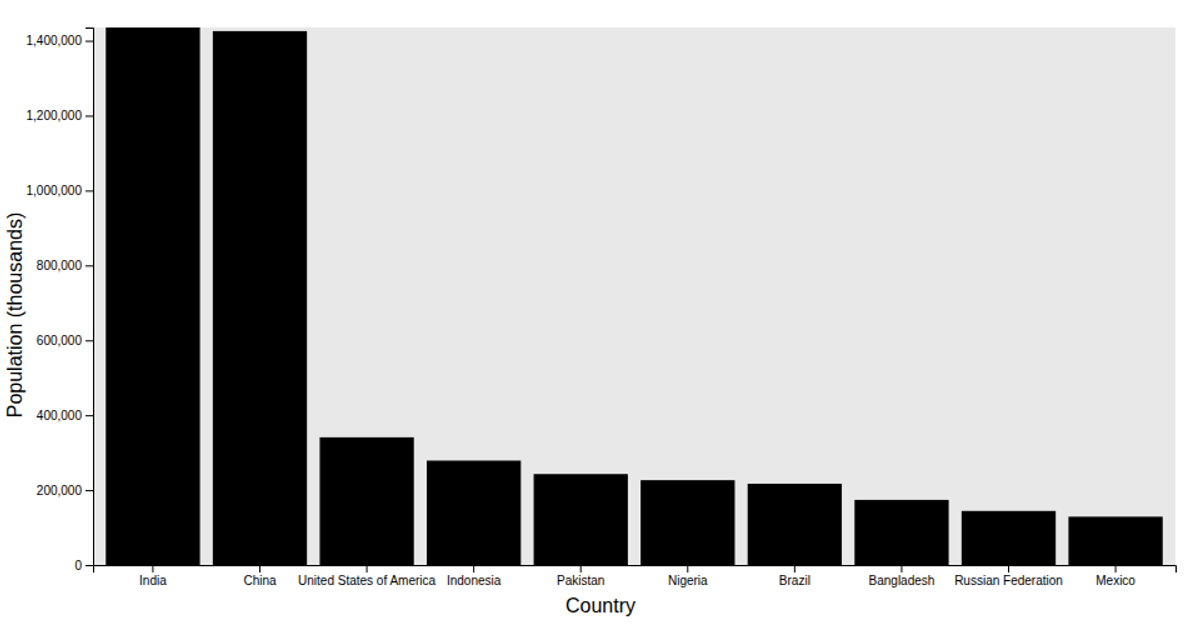
This example displays a bar chart of the top 10 most populous countries as of January 1, 2024. The data comes from the UN population estimates, filtered to Country/Area types and sorted descending by total population. The visualization uses D3.js APIs `scaleBand`, `scaleLinear`, and `axisLeft` to construct the chart, with the `viz` function applying margins, an inner rectangle fill, and axis labels. The chart shows each country's population in thousands along the y-axis, with bars representing values from the dataset.
AI-generated descriptionA bar chart showing the top 10 most populous countries on Earth as of January 1st 2024.
Challenge
- Fork this viz and modify it to show your own data
MIT Licensed


Comments
Sign in to join the discussion.