🌍 Public
Question
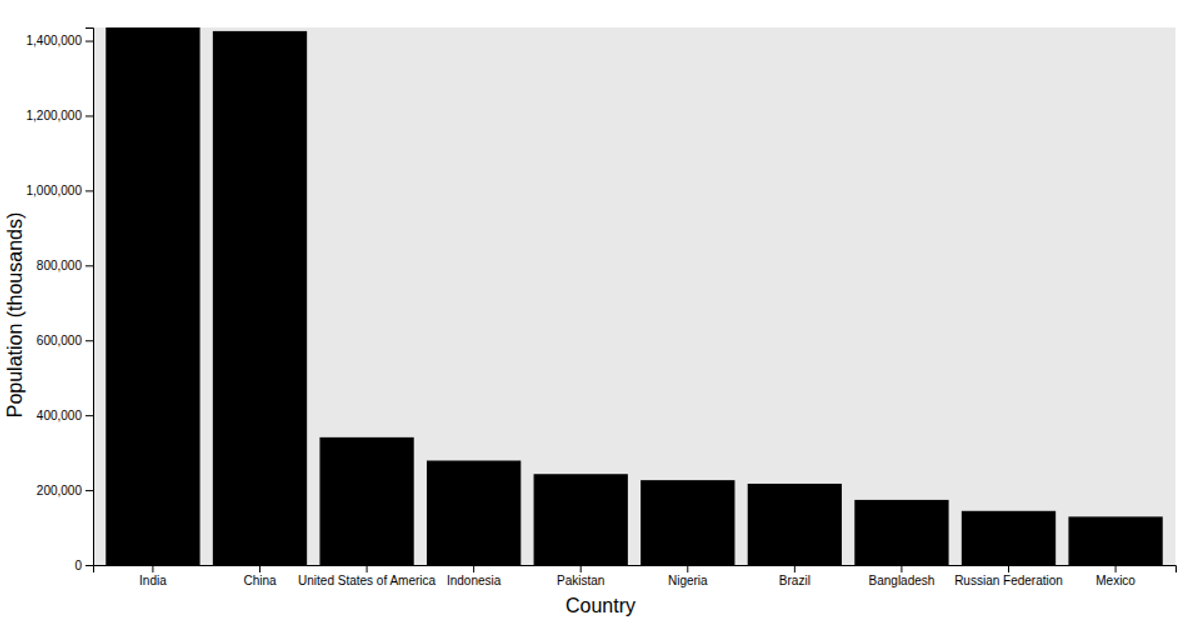
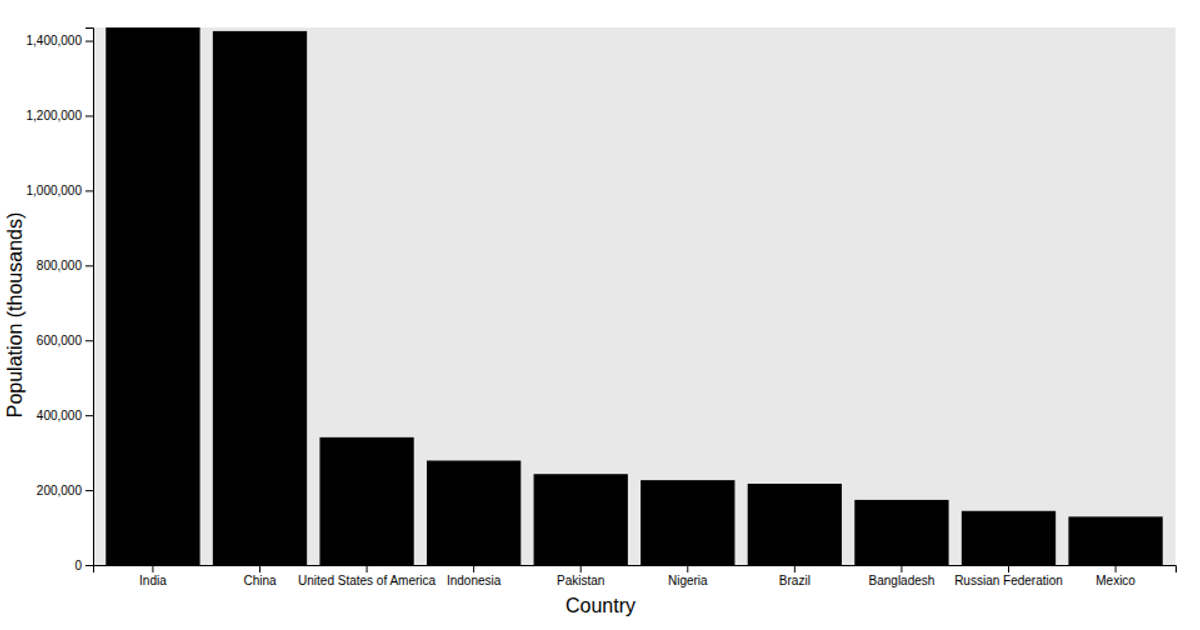
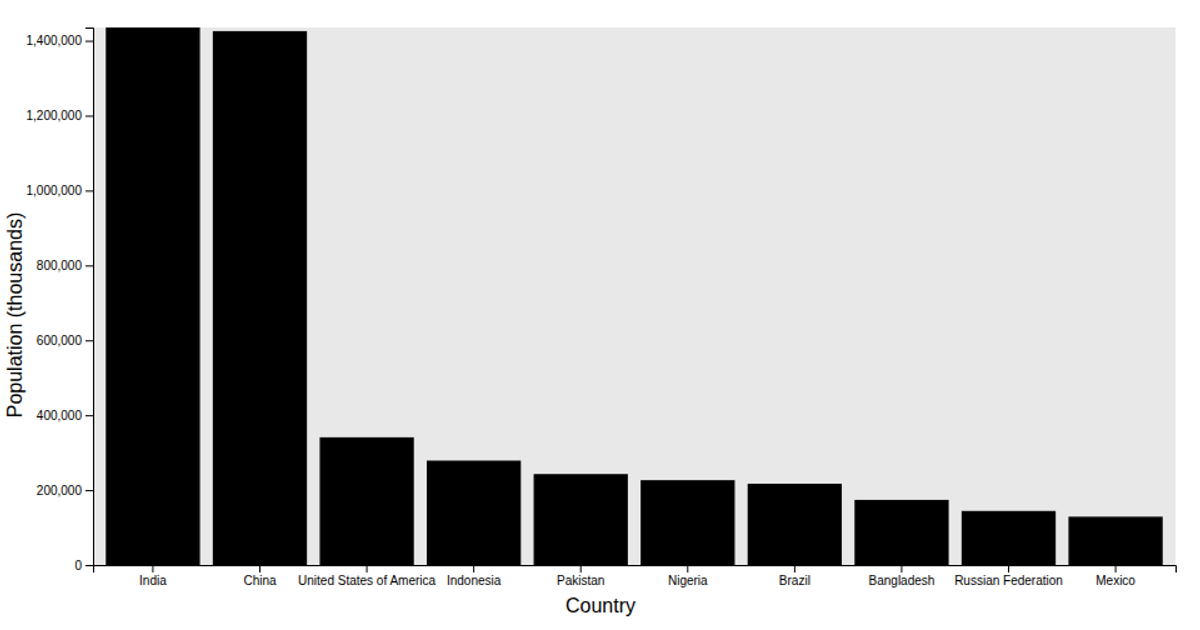
This bar chart shows the top 10 most populous countries on Earth as of January 1st, 2024. The code uses D3.js with `scaleBand` and `scaleLinear` to map country names to the x-axis and population values in thousands to the y-axis. It imports data from the `@curran/un-population-estimates-2024` package, filters for country-type records, and sorts them in descending order to select the top ten. The `viz` function renders axes, labels, and rectangles to create the visualization.
AI-generated descriptionA bar chart showing the top 10 most populous countries on Earth as of January 1st 2024.
Challenge
- Fork this viz and modify it to show your own data
MIT Licensed





Comments
Sign in to join the discussion.