🌍 Public
Bar Chart
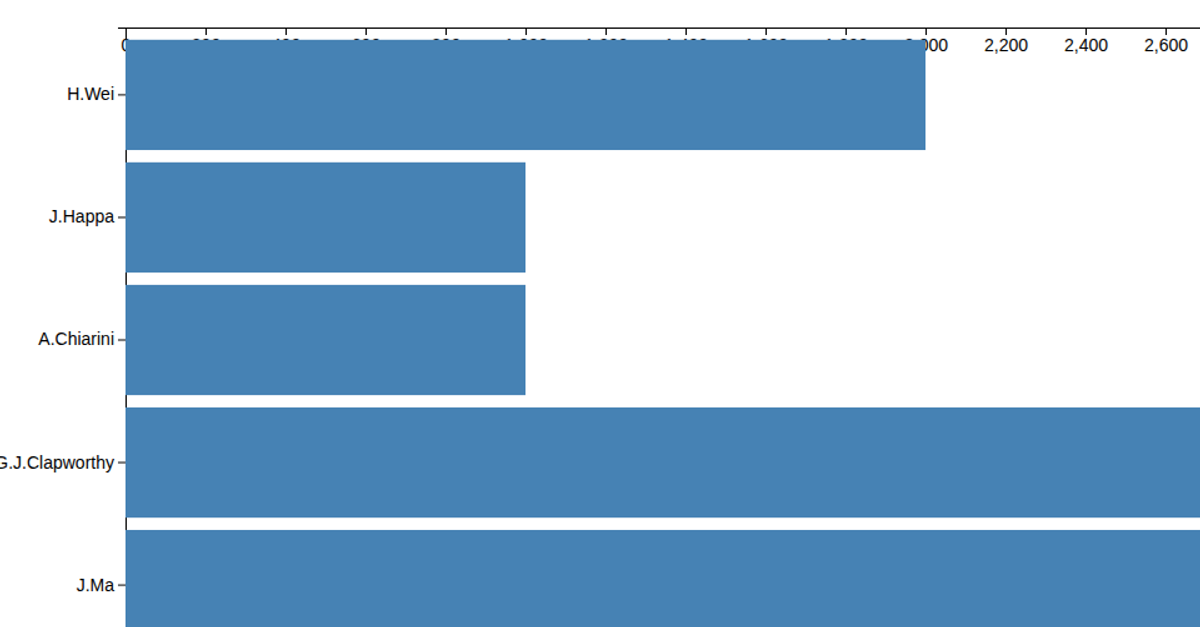
This bar chart displays the number of contributions made by each author, sourced from a CSV file. The chart renders as steelblue rectangles via SVG. The code uses d3’s `select`, `csv`, `scaleLinear`, and `max` functions to load the data and map the maximum contribution count to the scale’s domain, though the current implementation sets a fixed rectangle size rather than scaling the bars to their data values.
AI-generated descriptionMIT Licensed





Comments
Sign in to join the discussion.