🌍 Public
Fork of Making a Bar Chart
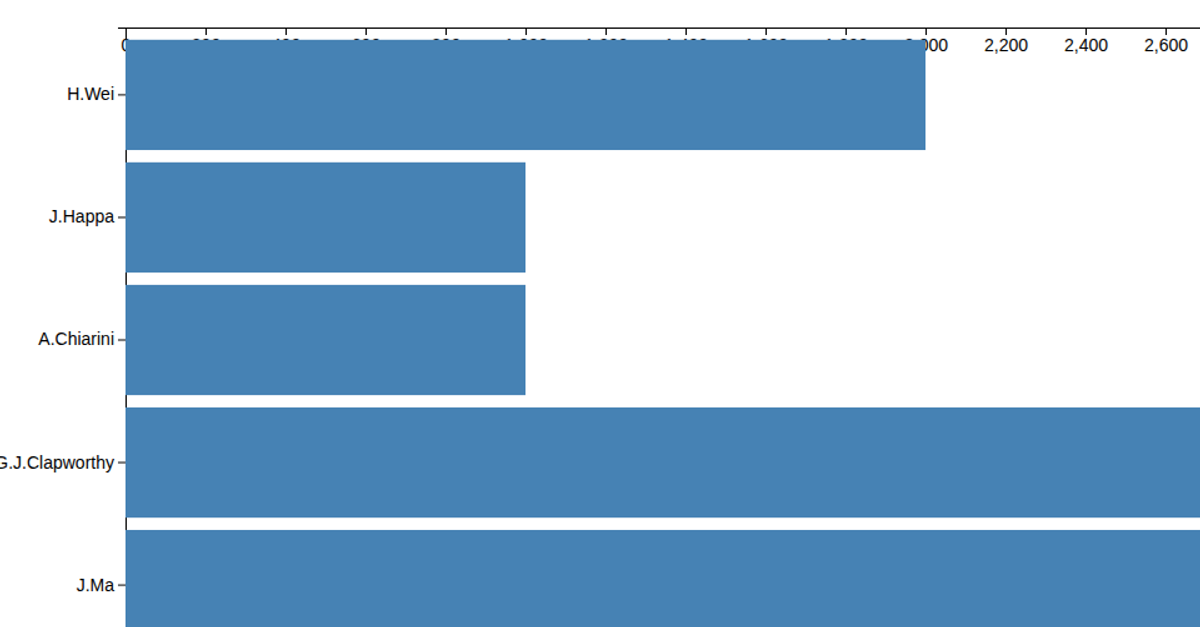
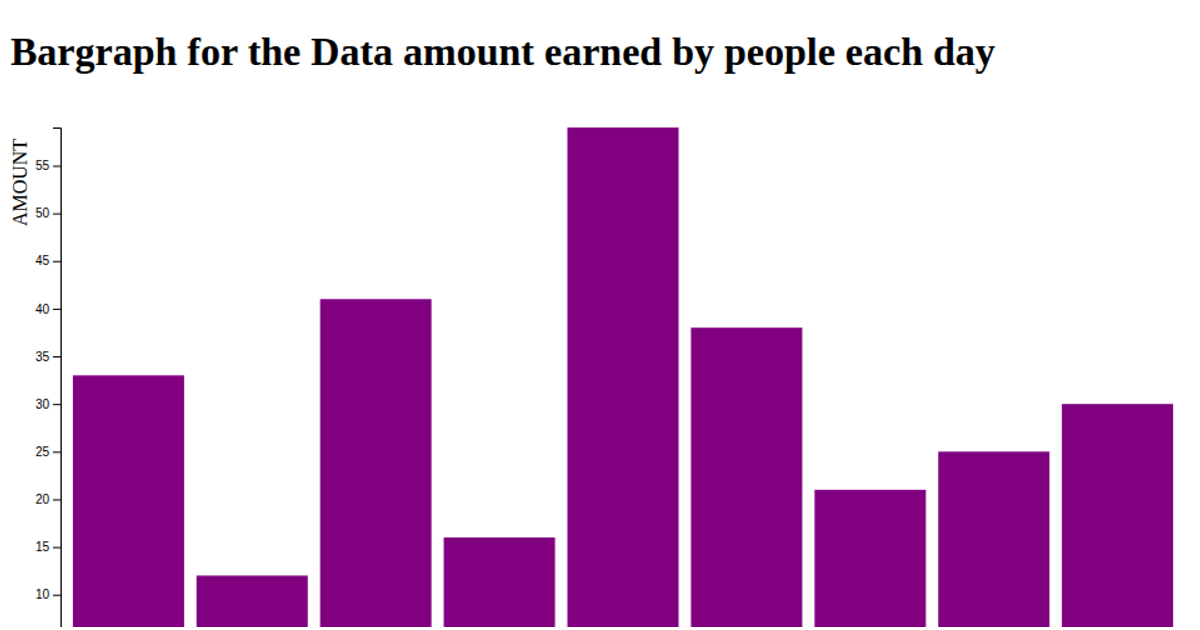
This horizontal bar chart displays the count of contributions per GitHub login, sorted by the login name. It uses D3 version 5 APIs including `scaleBand` and `scaleLinear` to map the data, and `axisLeft` for the y-axis. The chart reads from a CSV file, and the bars are rendered as SVG rectangles filled with steelblue using the `svg.append` method. The data is parsed to convert string counts to numbers before the chart is generated.
AI-generated descriptionMIT Licensed



Comments
Sign in to join the discussion.