🌍 Public
Activity 8-1
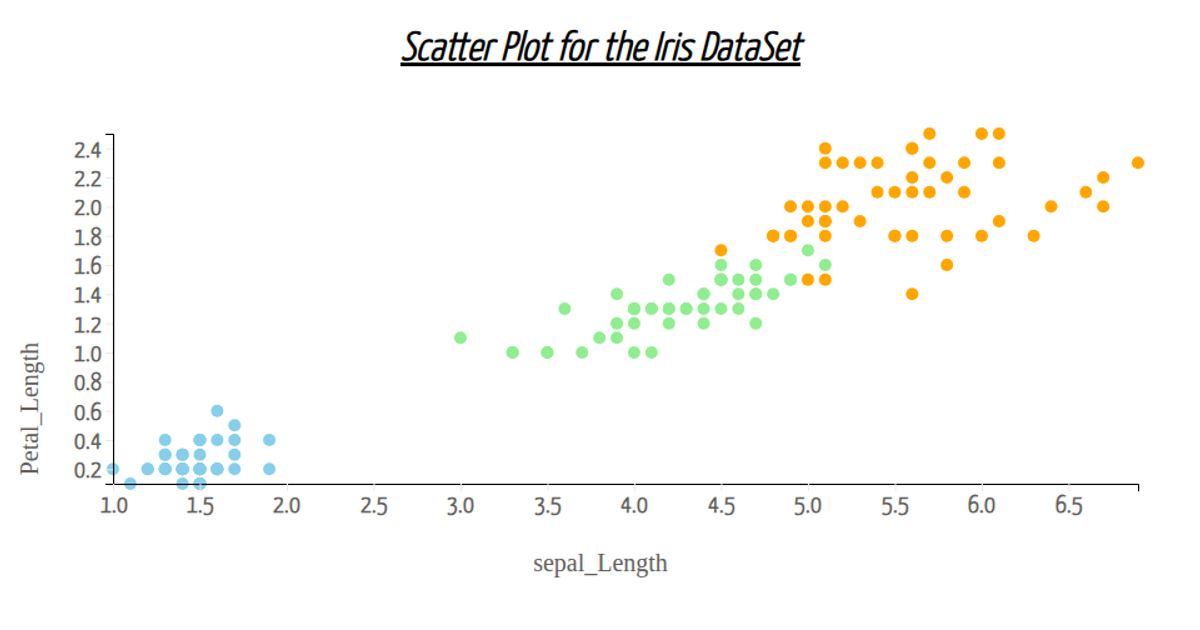
This scatter plot visualizes the Iris dataset, mapping petal length and width on the axes while coloring each point by species (setosa, versicolor, or virginica) using skyblue, lightgreen, or orange. The code loads the CSV via d3.csv, imports the scatterPlot module, and renders an SVG sized to the window. It demonstrates D3’s import syntax and local ES6 module usage, with styles from the Share Tech font and CSS.
AI-generated descriptionAn example showing the capabilities of VizHub:
- Loads D3 via UNPKG.
- Demonstrates use of
importfrom"d3". - Demonstrates use of
importfrom local ES6 modules.
MIT Licensed




Comments
Sign in to join the discussion.