🌍 Public
Activity 7 Scatter Plot
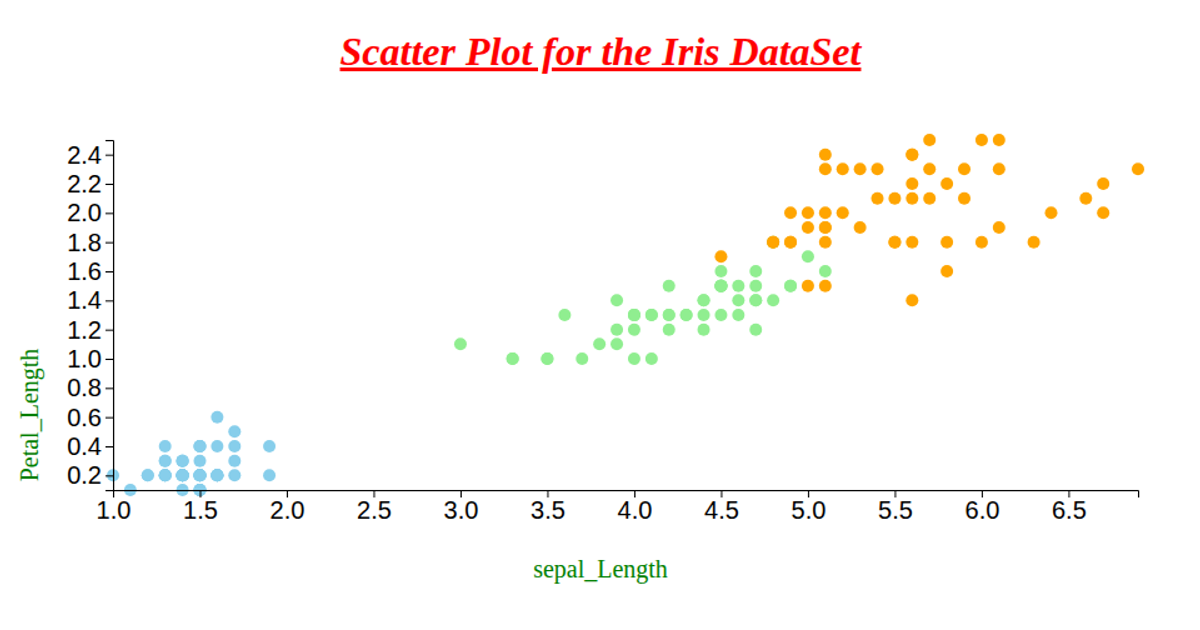
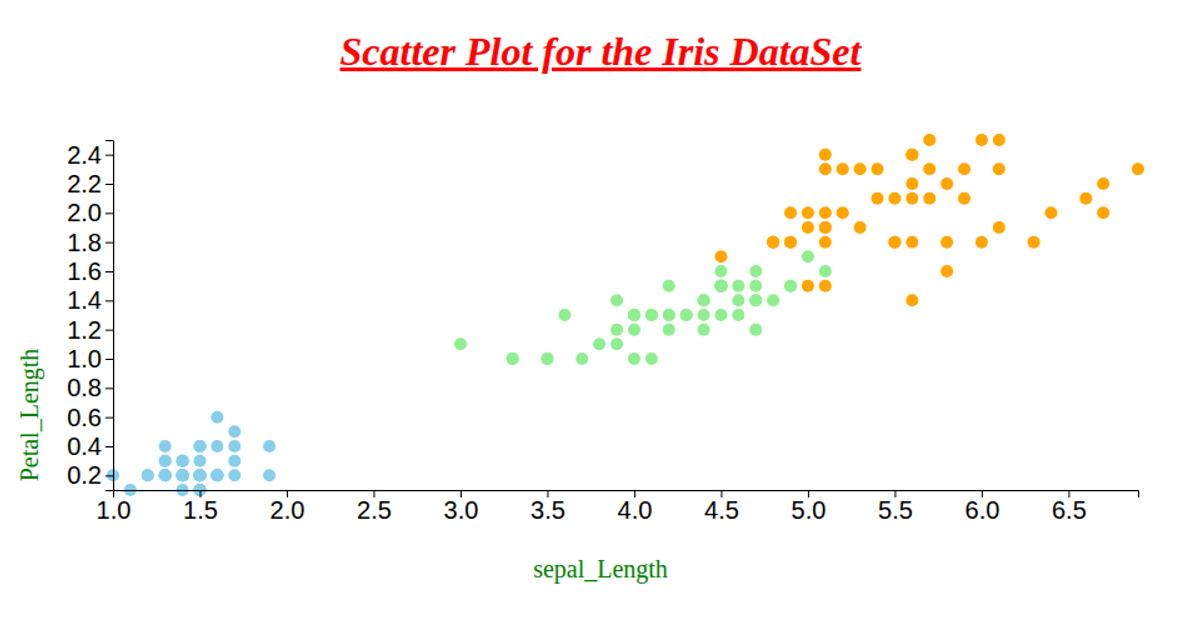
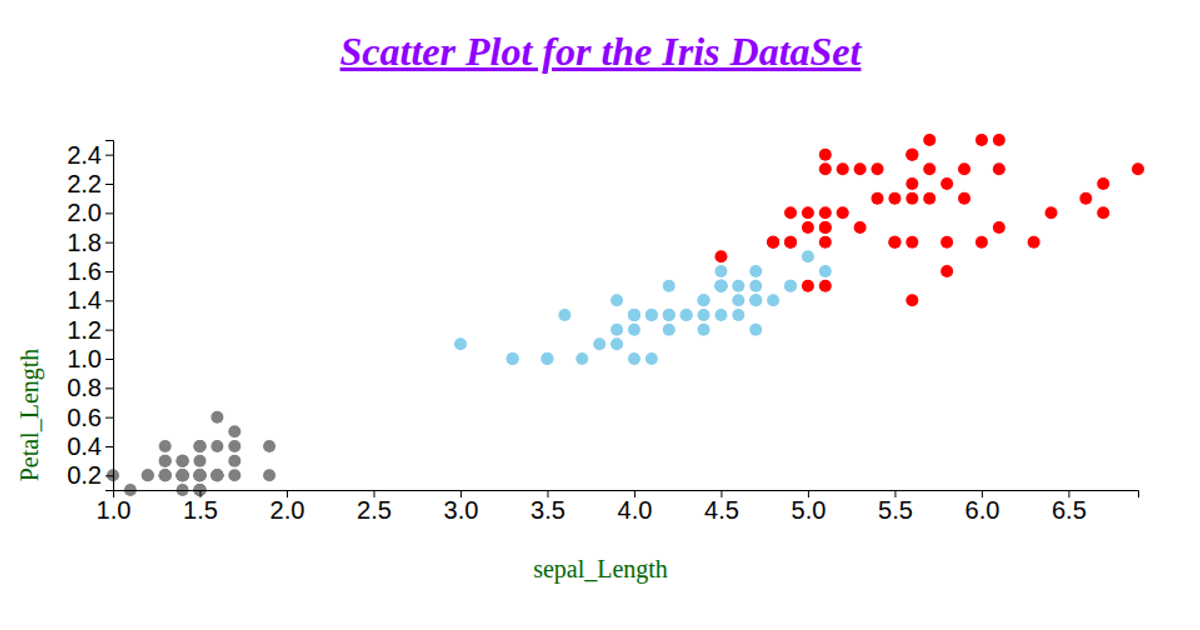
This scatter plot visualizes the Iris dataset by mapping petal length and width. Each circle is colored by species: setosa in blue, versicolor in yellow, and virginica in green. The code loads CSV data from a GitHub URL using d3.csv and renders the plot as SVG circles. It uses D3 v6 scales (scaleLinear), axes (axisLeft, axisBottom), and extent to position the marks. The visualization includes axis labels and a centered title.
AI-generated descriptionAn example showing the capabilities of VizHub:
- Loads D3 via UNPKG.
- Demonstrates use of
importfrom"d3". - Demonstrates use of
importfrom local ES6 modules.
MIT Licensed


Comments
Sign in to join the discussion.