🌍 Public
Dataviz 13 - Missing migrants log scale
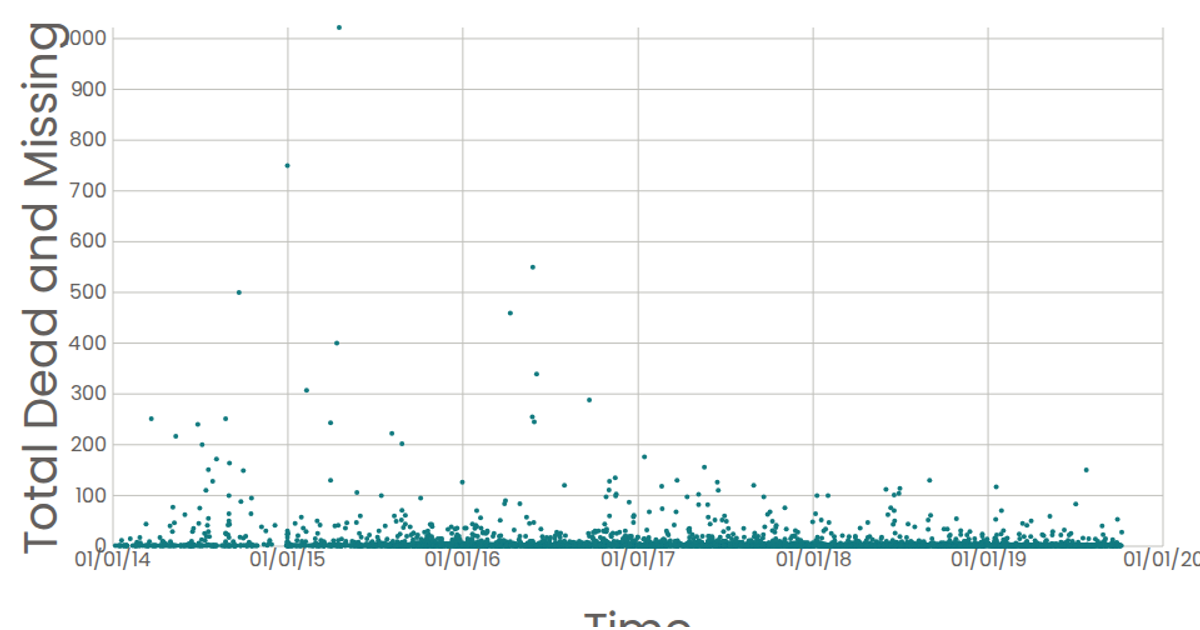
A scatter plot shows the reported dates of migrant incidents against the total number of dead and missing, using a logarithmic scale for the y-axis to accommodate wide value ranges. Each circle represents a data point from the Data Canvas Sense Your City Dataset, with tooltips displaying the formatted date. The visualization is built with React and D3 v5, using `scaleTime` and `scaleLog` for axes, and rendered as SVG elements.
AI-generated descriptionA scatter plot of Data Canvas Sense Your City Dataset.
MIT Licensed



Comments
Sign in to join the discussion.