🌍 Public
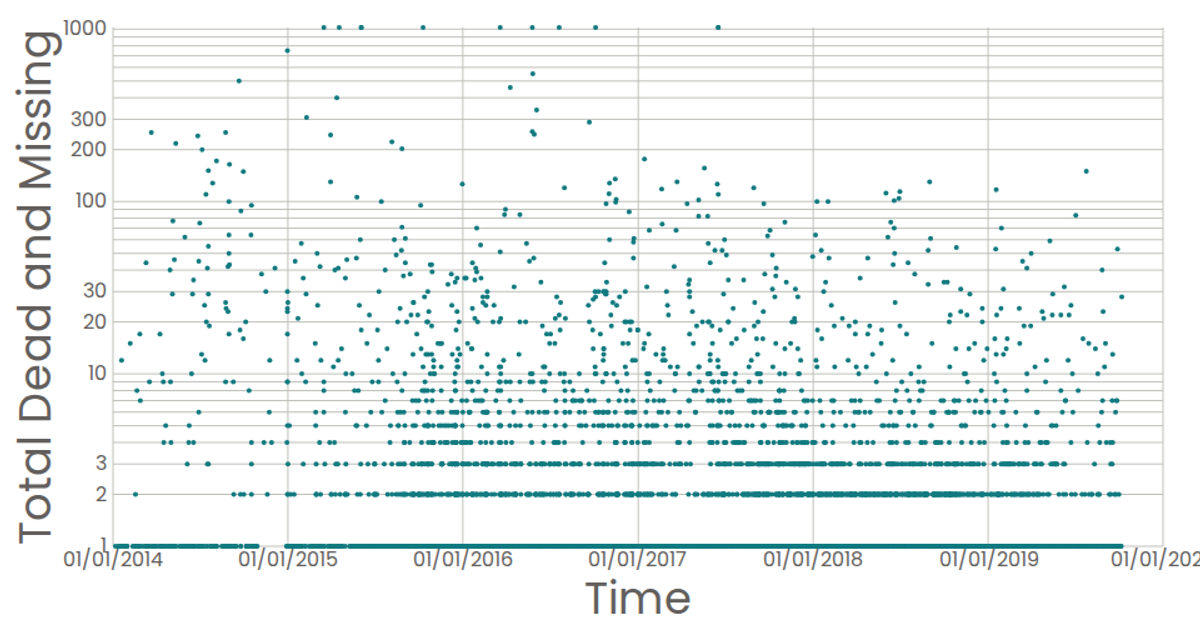
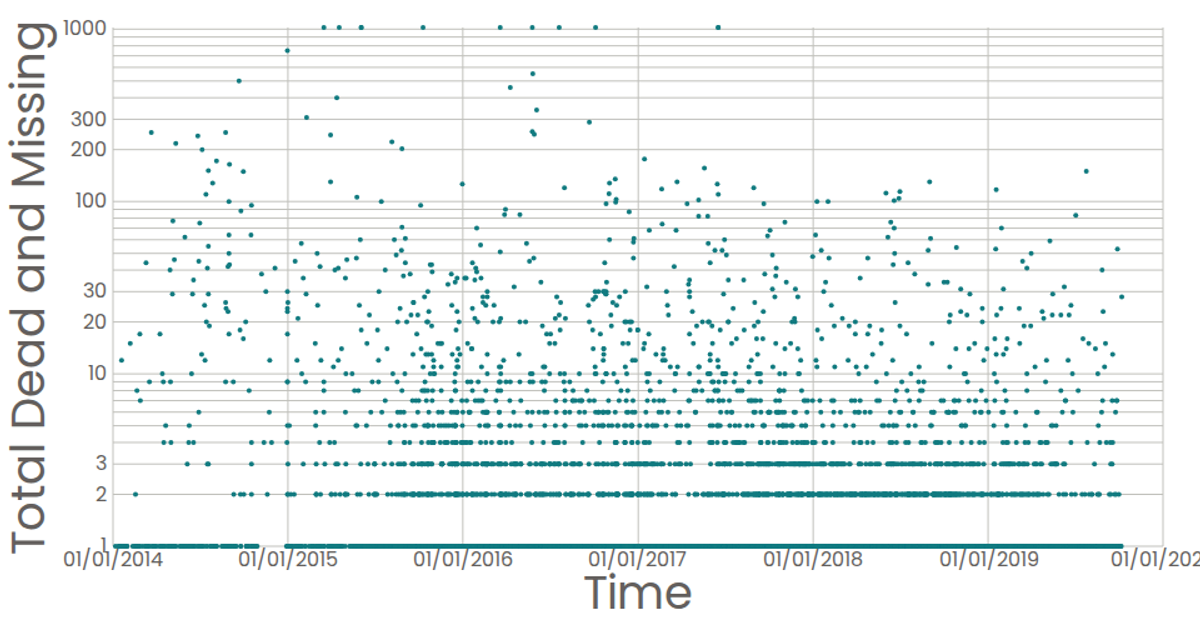
Missing Migrant Data Scatter Plot - Log Scale
This scatter plot visualizes reported dates of missing migrant incidents against total dead and missing counts, using a logarithmic y-axis to handle the wide range of values. The visualization loads CSV data from a GitHub gist and renders as an SVG using React and D3 v7. It employs `scaleTime` for the date axis, `scaleLog` for the count axis, and custom React components (`AxisBottom`, `AxisLeft`, `Marks`) to draw tick marks and circles. Native SVG `<title>` elements provide tooltips showing formatted counts.
AI-generated descriptionA scatterplot of temperature over time
MIT Licensed




Comments
Sign in to join the discussion.