0 views in last 90 days
K3zter
@K3zter
Public vizzes
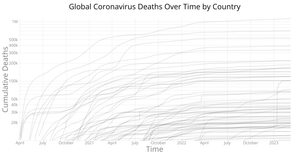
Coronavirus Chart with Multiple Lines by Country with Voronoi Overlay

Smiley Face Part II
D3 Translate Example

HTML Starter
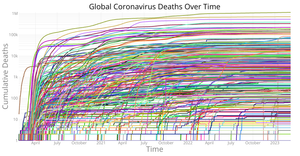
Coronavirus Chart with Multiple Lines
Coronavirus Log Y Axis
Coronavirus Linear Y Axis
React + Axes
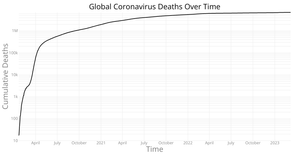
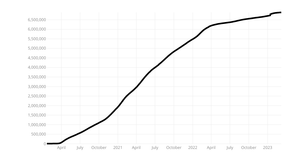
Coronavirus Basic Line Chart With Margins
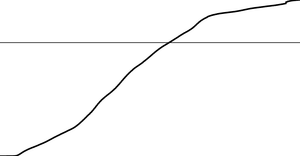
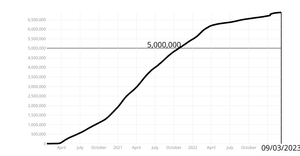
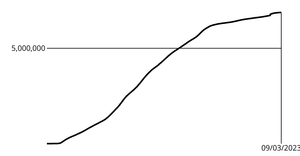
Coronavirus Basic Line Chart With 5,000,000 Marker Line

Summarizing Coronavirus Data

Loading and Parsing Coronavirus Data
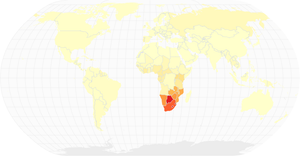
HIV/AIDS Choropleth Map
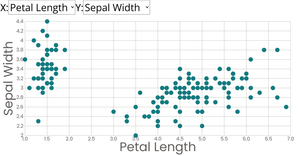
Scatterplot with Menus
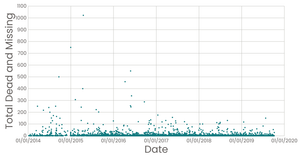
Missing Migrant Data Scatter Plot - Log Scale
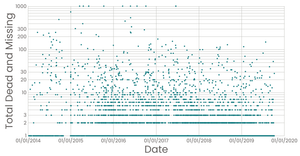
Missing Migrant Data Scatter Plot
Missing Migrants Dataset - Brushing
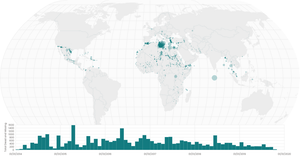
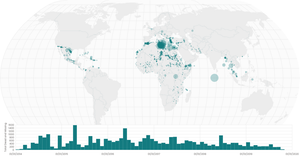
Missing Migrants Dataset - Map and Histogram
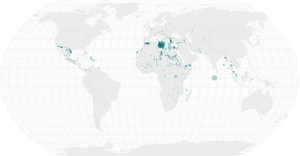
Missing Migrants Dataset - Map
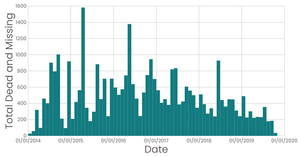
Migrant Deaths Over Time
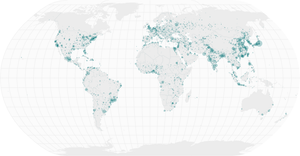
Points on a Map
Interactive Color Legend

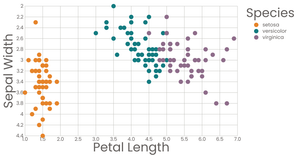
Scatterplot with Color Legend
Scatterplot with Color

Polished Scatterplot with Menus

Menus With React

React Starter

World Map
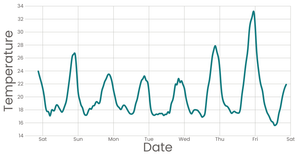
Line Chart
Working With Time
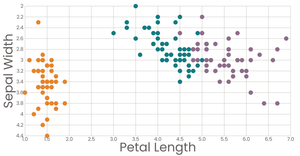
Stylized Scatterplot
Stylized Bar Chart

Refactored Bar Chart
Axes with React & D3

The Margin Convention

Simple Bar Chart

Rendering Data with React

Fork of Loading Data with React & D3
Fork of Vega-Lite API Template

Loading Data with React & D3

Loading and Parsing CSV Data

Mouse Follower