🌍 Public
Vega-Lite API Template III
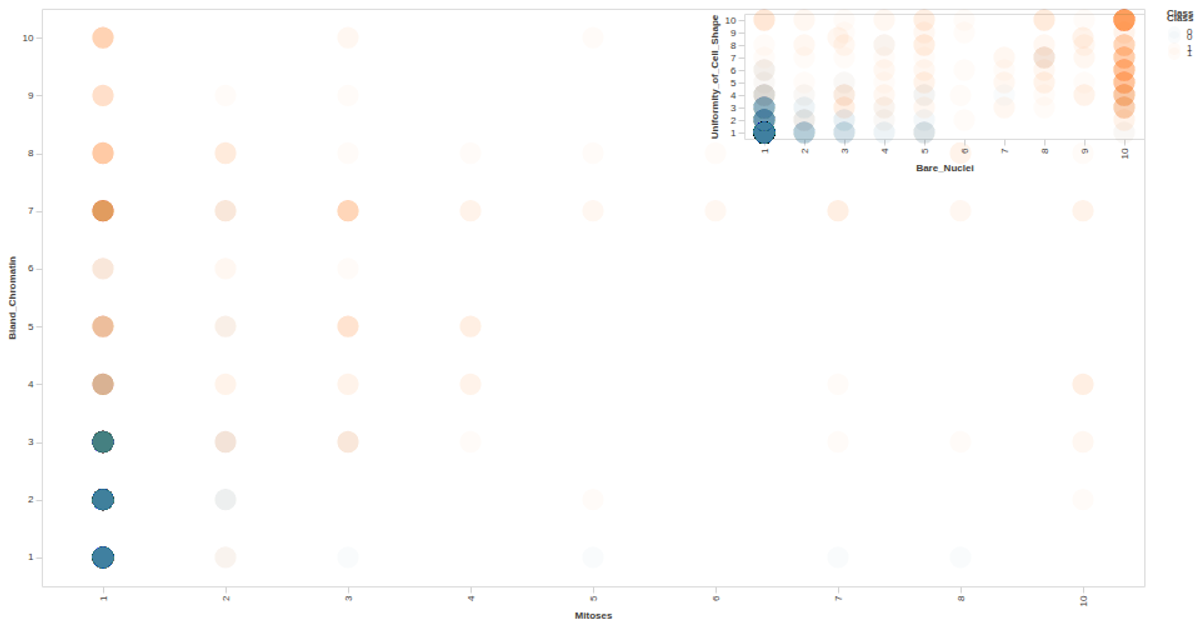
This example visualizes the relationship between Mitoses and Bland_Chromatin measurements from the UCI Auto MPG dataset, with points colored by Class and tooltips revealing the class label. Built using the Vega-Lite API with D3.js for data loading, it renders an interactive scatter plot as SVG. The visualization uses `vl.markCircle`, `vl.x().fieldO()`, `vl.y().fieldO()`, and `vl.tooltip()` to encode the data, with a custom config adjusting axis and label styles for readability.
AI-generated descriptionA visualization constructed using the vega-lite-api.
The data shown here comes from the UCI Machine Learning Repository: Auto MPG Data Set, via Gist: Scatter Plot with Menus.
MIT Licensed



Comments
Sign in to join the discussion.