🌍 Public
Vega-Lite API Template II
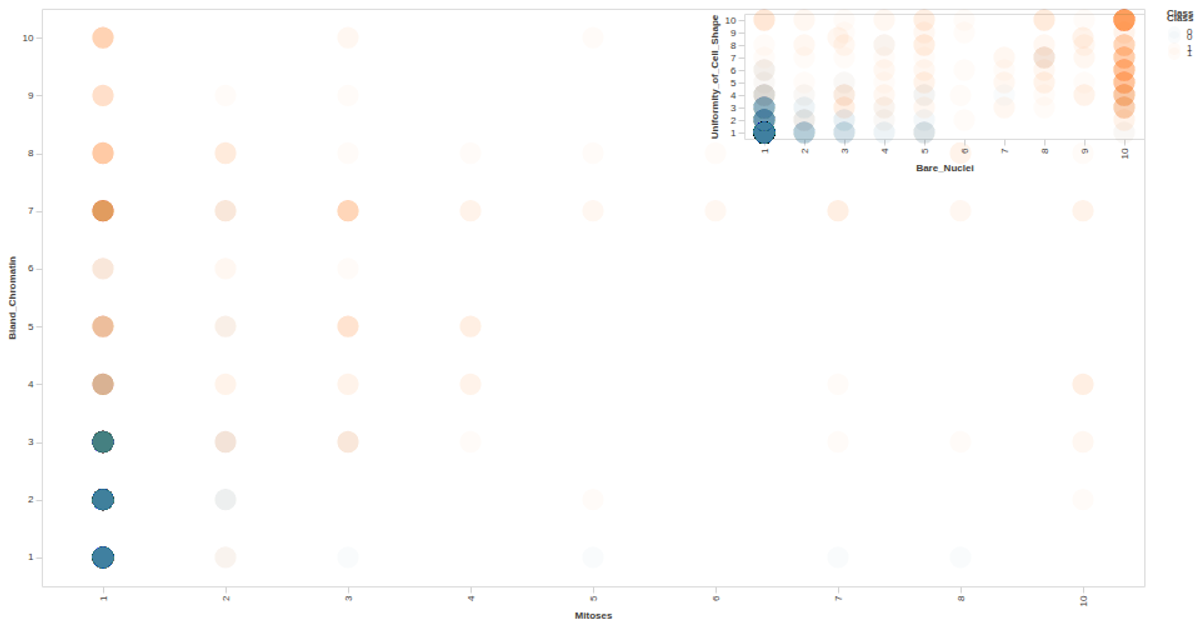
This interactive scatter plot visualizes the Auto MPG dataset, showing the relationship between Mitoses and Bland Chromatin, with points colored by Class and tooltips displaying the class label. Built with the Vega-Lite API, it registers Vega and Vega-Lite through `vl.register()`, loads CSV data via d3’s `csv` function, and applies custom axis and label styling from a config object. The visualization dynamically sizes to the window and uses SVG rendering with a Vega Tooltip handler for interactivity.
AI-generated descriptionA visualization constructed using the vega-lite-api.
The data shown here comes from the UCI Machine Learning Repository: Auto MPG Data Set, via Gist: Scatter Plot with Menus.
MIT Licensed



Comments
Sign in to join the discussion.