🌍 Public
Project Momentum v4
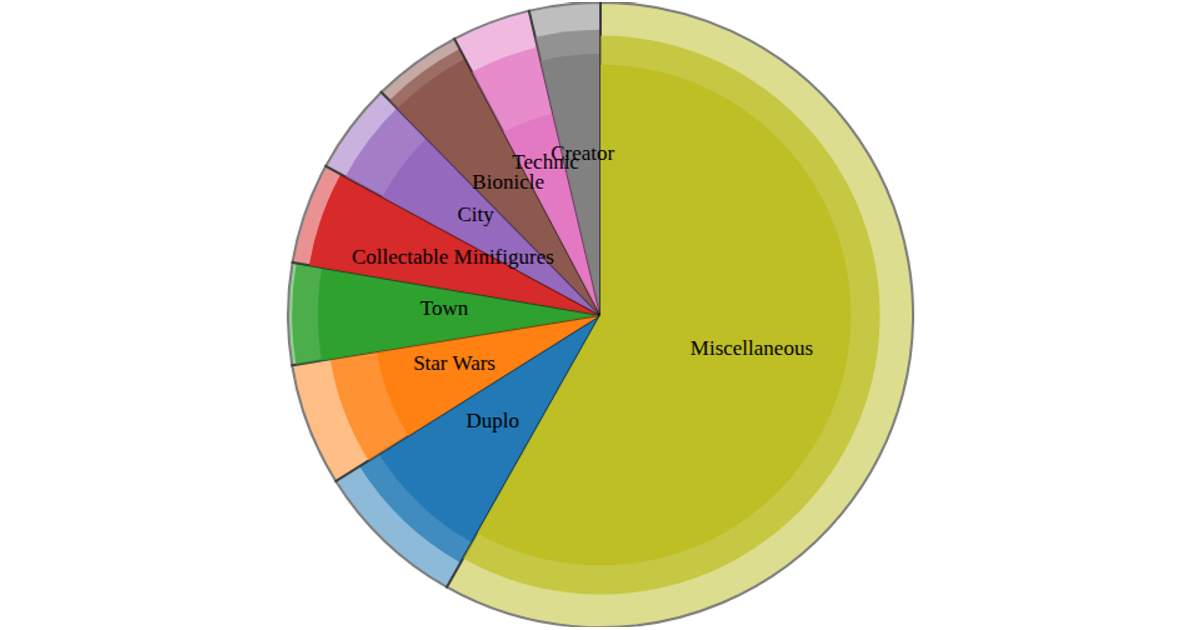
This donut chart visualizes the distribution of LEGO sets by theme and price, showing the proportion of sets in eight top themes plus a "Miscellaneous" category. It uses D3 pie arcs and labels for each theme, with each arc segment’s color representing its theme and opacity indicating price range (under $50, $50–100, over $100, or unknown). A legend allows interactive highlighting: hovering a price category dims other segments. The visualization is built using D3's `pie` for arc generation, `arc` for path geometry, `scaleOrdinal` with `schemeCategory10` for colors, and a `ResizeObserver` for responsive sizing.
AI-generated descriptionMIT Licensed





Comments
Sign in to join the discussion.