🌍 Public
Fork of Project Momentum v3
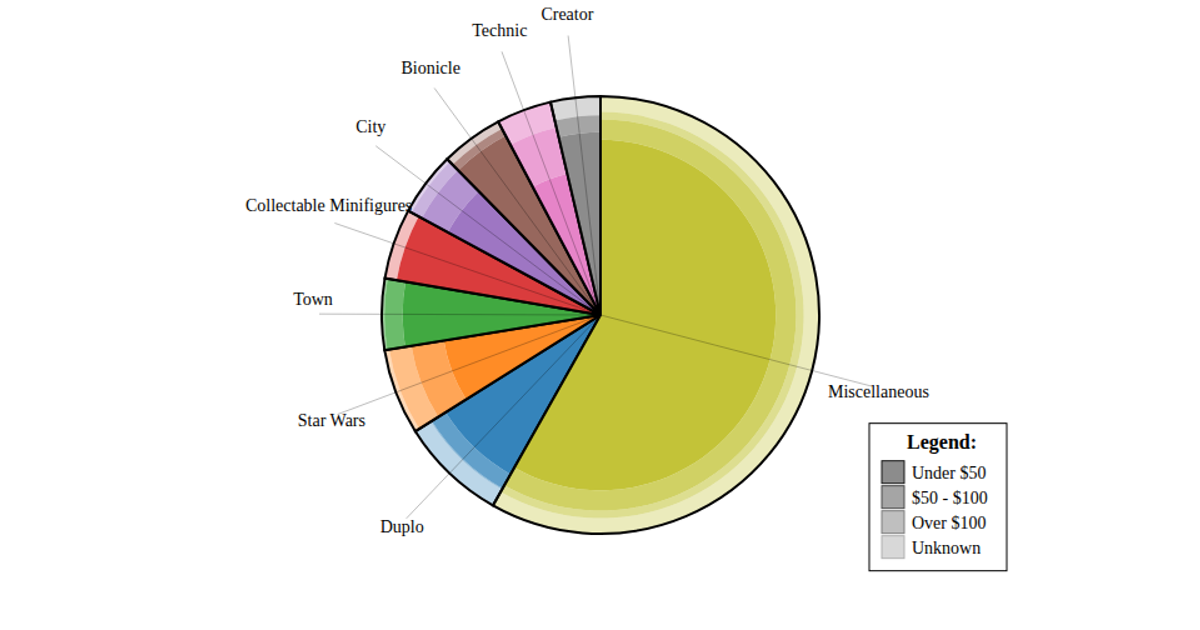
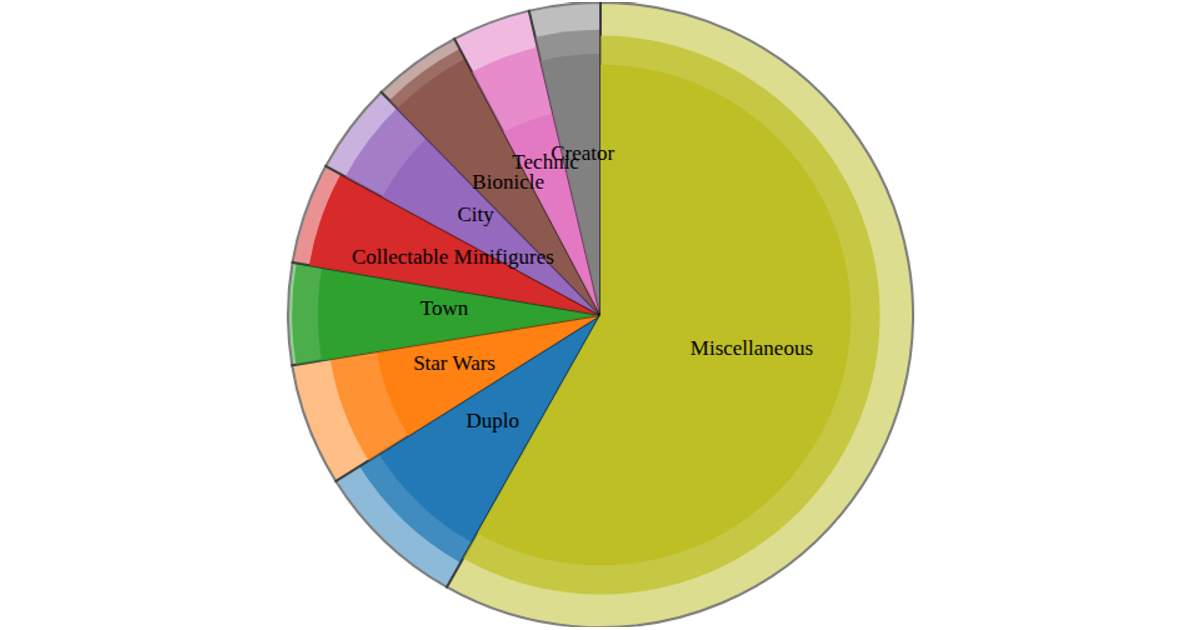
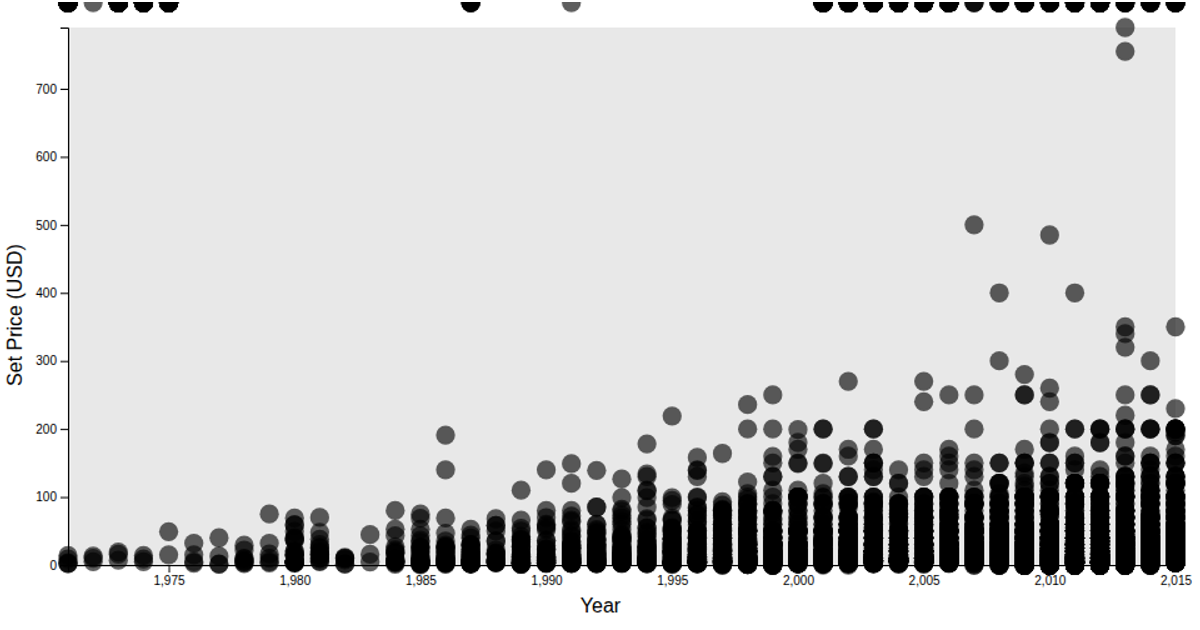
This visualization displays the distribution of LEGO sets by theme, using a nested donut chart where three concentric arcs per slice show the total count, the number of sets priced under $100, and those under $50. Hovering dims non-selected arcs via opacity adjustments. The chart is built with D3’s `pie` and `arc` generators, with data imported from the `@Landaman/lego-csv` package and grouped by theme. Color mapping uses `scaleOrdinal` with `schemeCategory10`, while labels and leader lines are positioned using `arc().centroid`.
AI-generated descriptionMIT Licensed




Comments
Sign in to join the discussion.