🌍 Public
PM Emissions in the Metropolitan City of Cagliari, multilanguage
AAndrea Picciau
Last edited Jan 16, 2022
Created on Jan 15, 2022
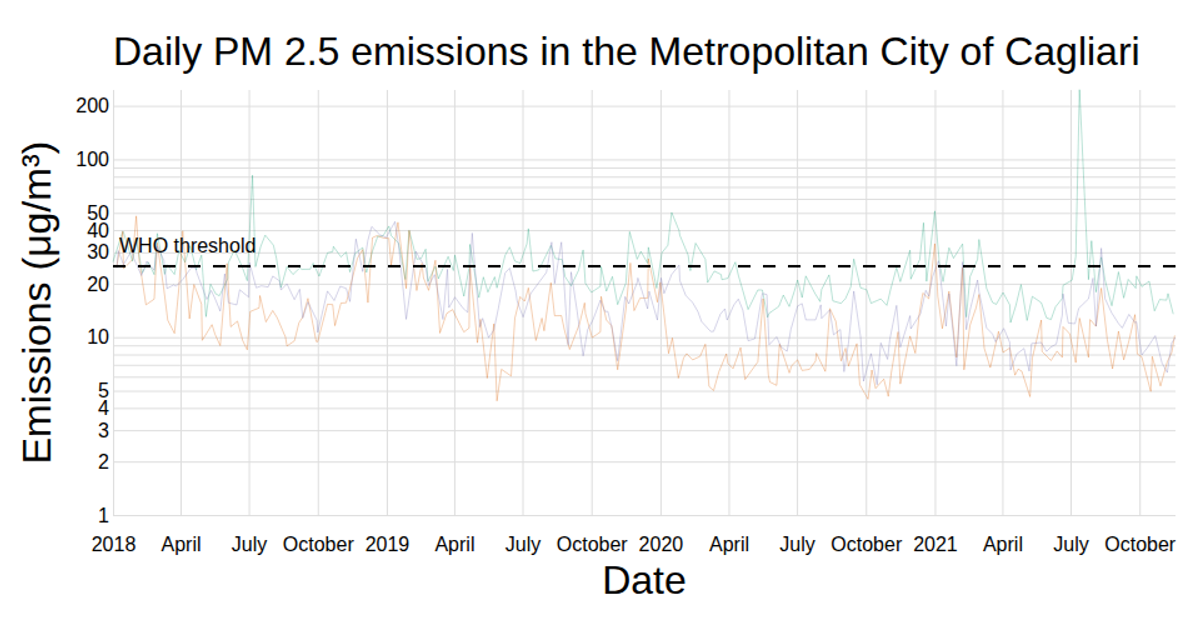
A multi-line chart displays daily average PM2.5 and PM10 emissions from monitoring stations in the Metropolitan City of Cagliari, alongside a dashed WHO threshold line. The visualization supports English, Italian, and Sardinian text. Built with React and D3, it uses `d3.csv` for data loading, `d3.scaleTime` and `d3.scaleLinear` for axes, and a Voronoi overlay for interactive tooltips on hover, highlighting values above the threshold.
AI-generated descriptionA Voronoi-based chart to display the data about PM emissions in the Metropolitan City of Cagliari.
MIT Licensed



Comments
Sign in to join the discussion.