🌍 Public
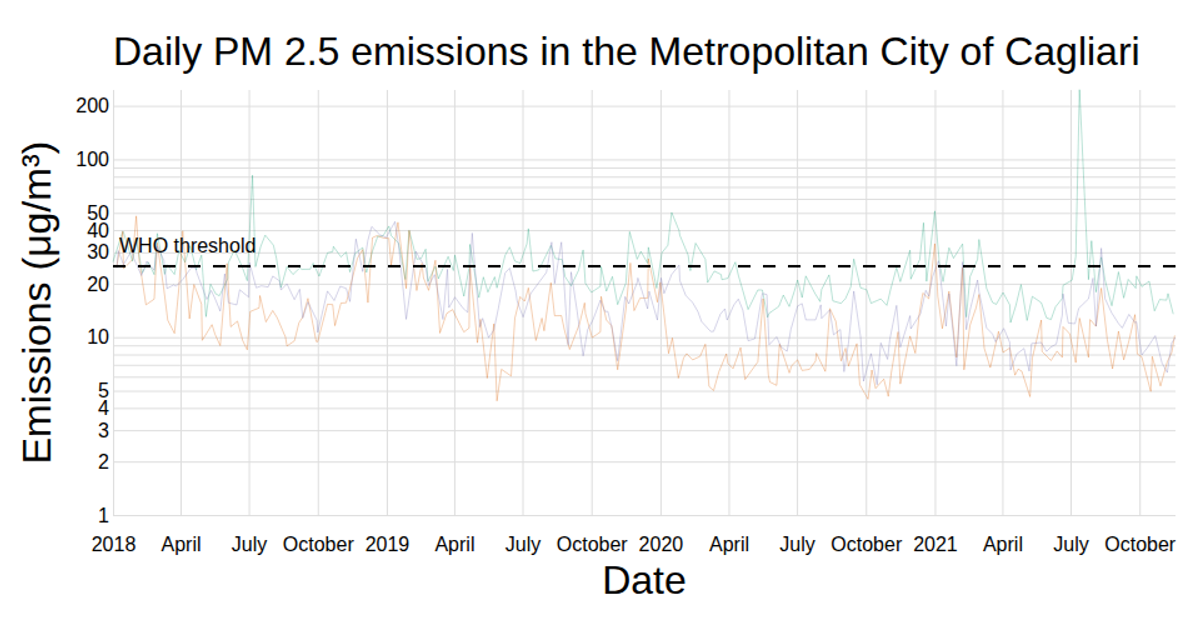
PM Emissions in the Metropolitan City of Cagliari
AAndrea Picciau
Last edited Jan 15, 2022
Created on Dec 1, 2021
This visualization displays daily average PM 2.5 and PM 10 emissions across multiple monitoring stations in the Metropolitan City of Cagliari. The chart shows time series lines with a dashed World Health Organization threshold line, using a Voronoi overlay via `d3.Delaunay` for hover detection. React manages state for pollutant selection and tooltips, while D3’s `scaleTime`, `scaleLinear`, and `line` handle scaling and path generation. Data comes from a CSV of daily emissions, rendered with SVG.
AI-generated descriptionA Voronoi-based chart to display the data about PM emissions in the Metropolitan City of Cagliari.
MIT Licensed



Comments
Sign in to join the discussion.