🌍 Public
3D Bar Chart
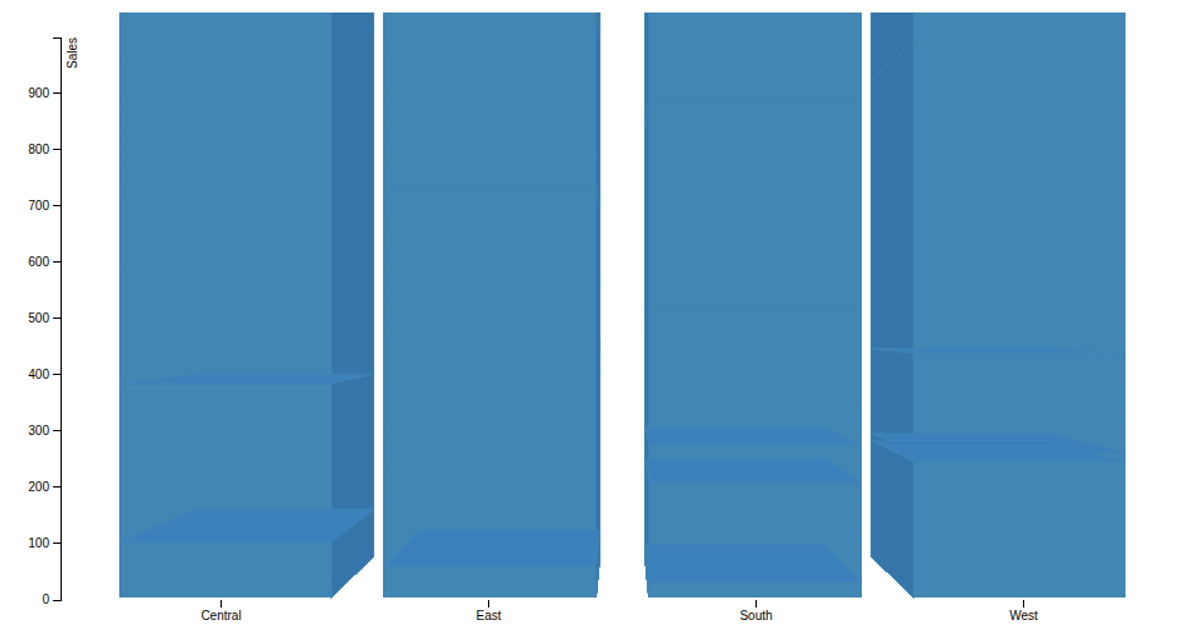
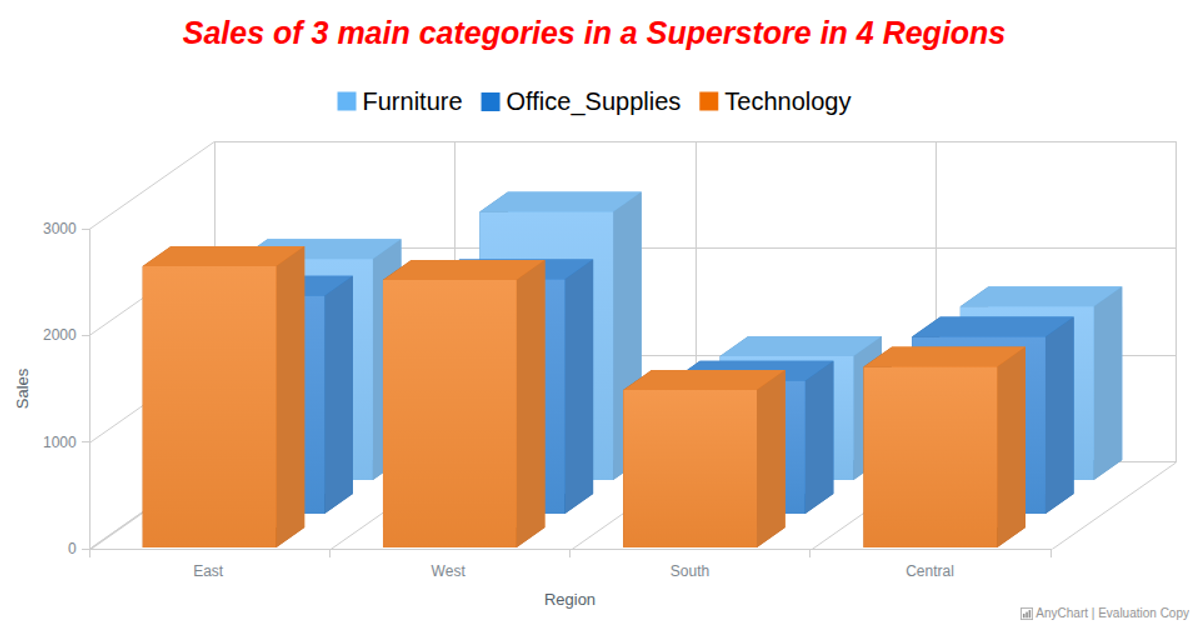
This 3D bar chart visualizes revenue from the top three beauty products across Florida, Texas, Arizona, and Nevada. Built with the AnyChart JavaScript library, it uses three-dimensional bars with a 45-degree z-axis angle and 3D depth perspective to represent the multi-series data. The chart maps four data columns from a static data set to individual series, applies a dollar format to the y-axis labels, and enables animated transitions, tooltips, and hover interactions.
AI-generated descriptionMIT Licensed





Comments
Sign in to join the discussion.