🌍 Public
Untitled
Ssalimjivani
Last edited Mar 12, 2022
Created on Mar 10, 2022
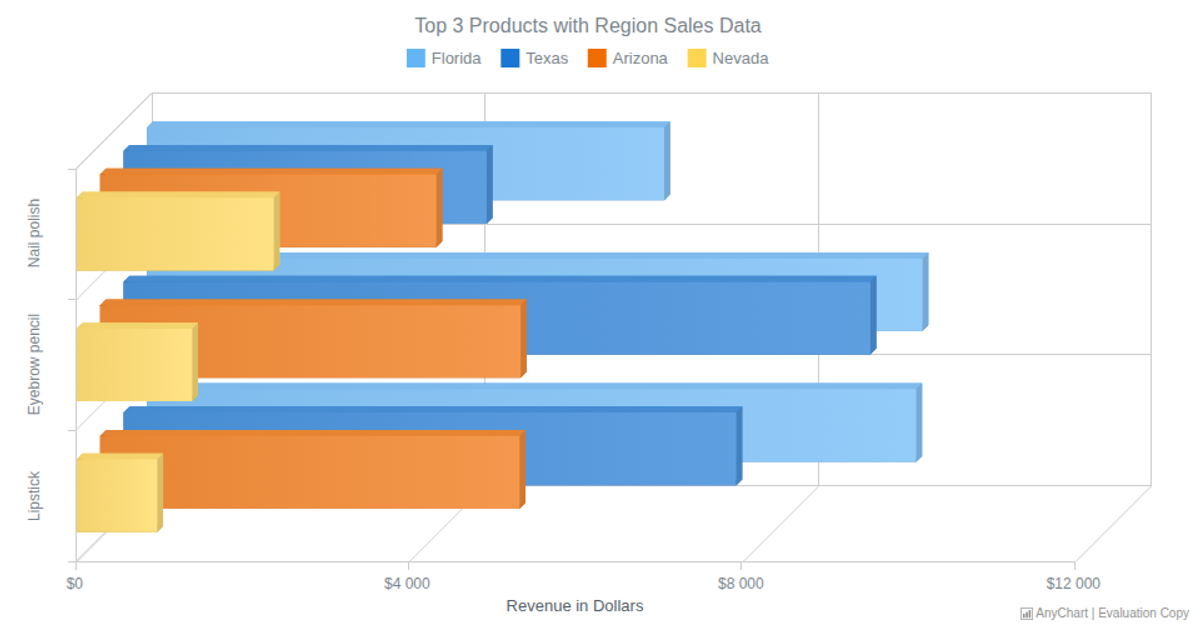
A 3D bar chart displays revenue for three product categories across four states, with vertical bars for Nail polish, Eyebrow pencil, and Lipstick, and color-coded series for Florida, Texas, Arizona, and Nevada. The chart is built using the AnyChart JavaScript library, which handles data mapping, animation, tooltips, and legend rendering. The SVG output is generated dynamically via the AnyChart API, with dollar-formatted Y-axis labels and rotated x-axis labels.
AI-generated descriptionA bare minimum HTML page demonstrating use of CSS and JavaScript.
See also React Starter.
MIT Licensed



Comments
Sign in to join the discussion.