🌍 Public
Fork of Cheap Tricks for Interaction
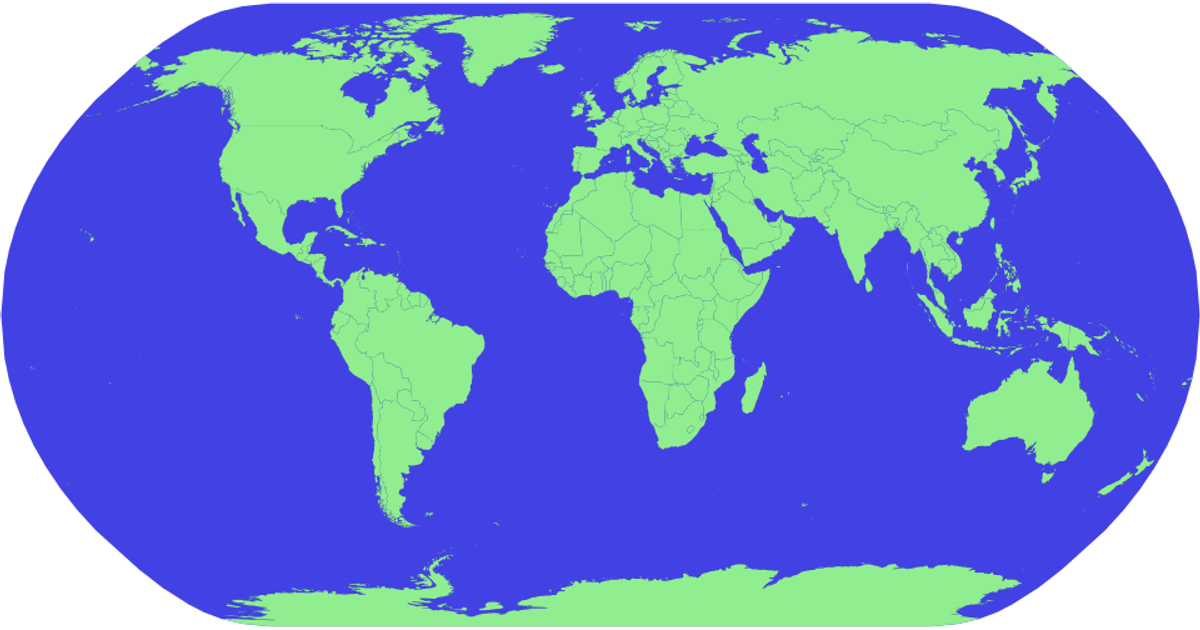
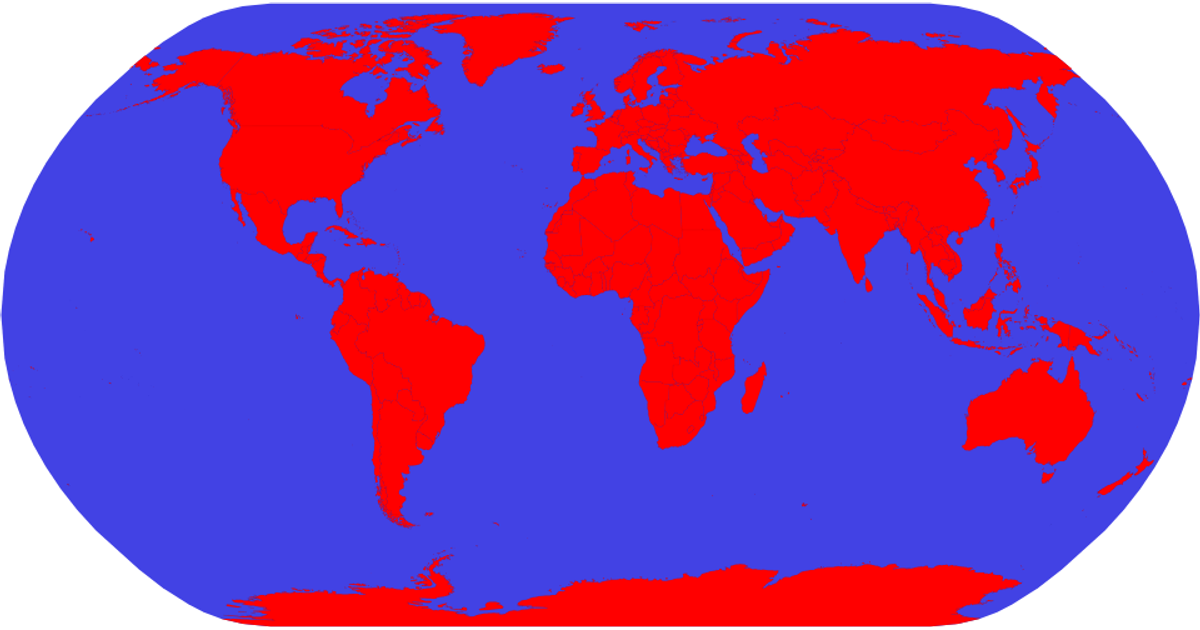
This example shows an interactive world map that highlights countries in red on hover, with a blue ocean background. The visualization uses the `d3.geoNaturalEarth1` projection and `d3.geoPath` to render country boundaries from TopoJSON data, while a separate TSV file provides country names for tooltips. The map supports zooming and panning through the `d3.zoom` interaction module, which applies transform updates to the SVG group containing the paths. Countries are styled with CSS classes, and hover effects change their fill color using the `.country:hover` selector.
AI-generated descriptionMIT Licensed




Comments
Sign in to join the discussion.