🌍 Public
Pie Chart (with labels) with d3
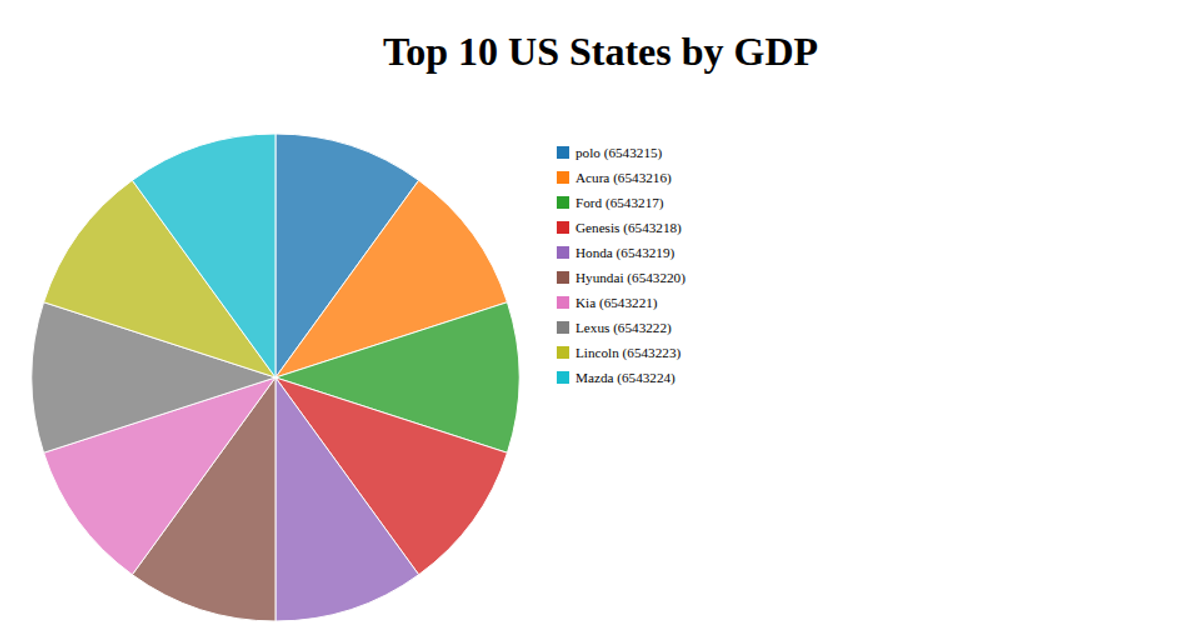
This example shows a pie chart comparing weather conditions across ten Walmart locations, with slices labeled by festival names and their corresponding values. Built with React and rendered as SVG, the chart uses d3.pie() and d3.arc() to generate the slices, while d3.scaleOrdinal with d3.schemeCategory10 assigns colors. Interactive hover effects adjust slice opacity and display a tooltip containing the location name and value, positioned via d3.mouse(). Data is loaded from an external CSV file using d3.csv.
AI-generated descriptionMIT Licensed






Comments
Sign in to join the discussion.